Immigrants from South America vs Bahamian In Labor Force | Age 16-19
COMPARE
Immigrants from South America
Bahamian
In Labor Force | Age 16-19
In Labor Force | Age 16-19 Comparison
Immigrants from South America
Bahamians
33.3%
IN LABOR FORCE | AGE 16-19
0.1/ 100
METRIC RATING
293rd/ 347
METRIC RANK
34.6%
IN LABOR FORCE | AGE 16-19
1.4/ 100
METRIC RATING
254th/ 347
METRIC RANK
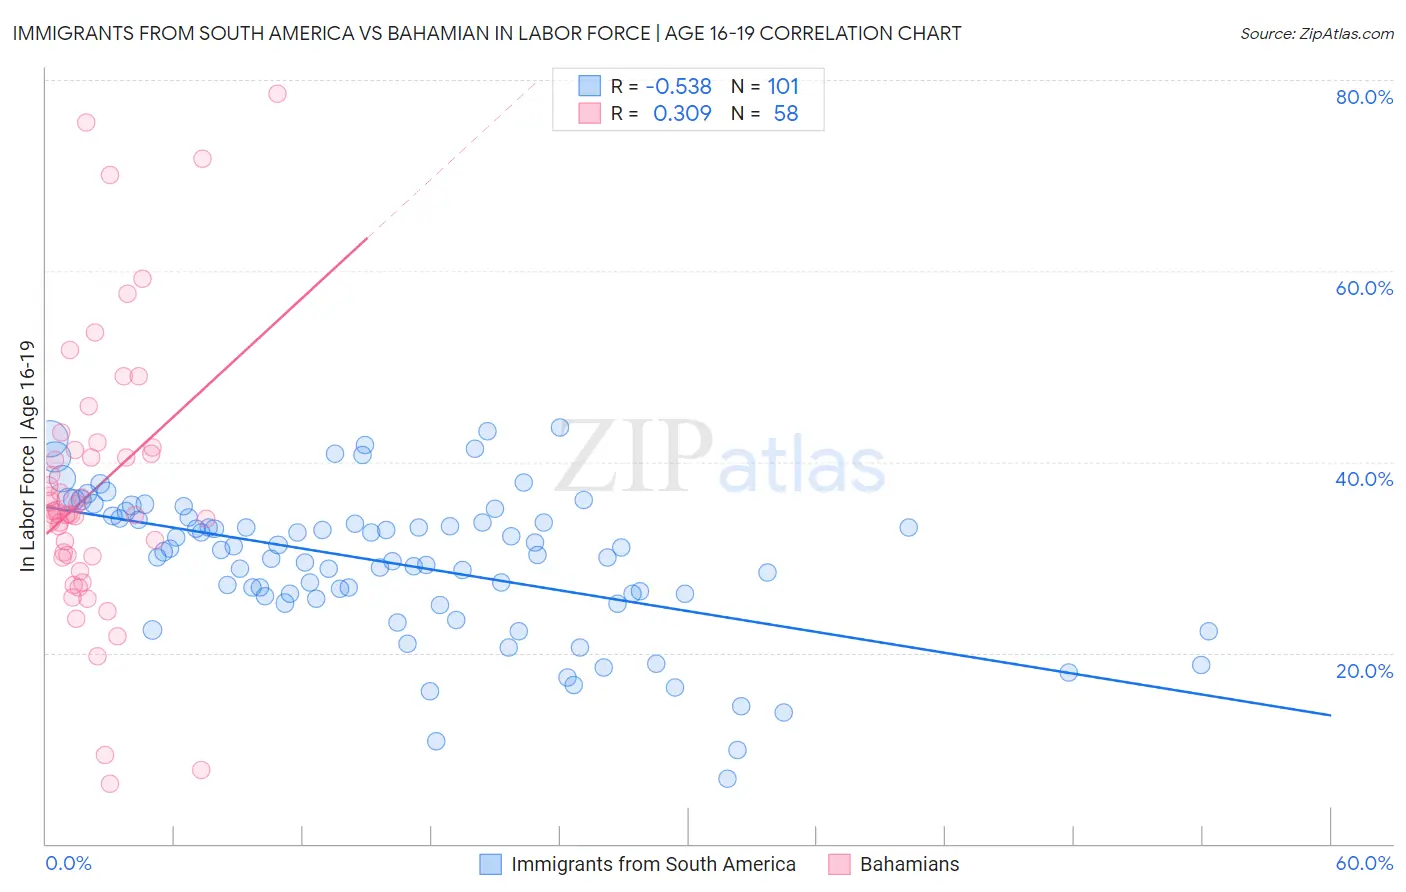
Immigrants from South America vs Bahamian In Labor Force | Age 16-19 Correlation Chart
The statistical analysis conducted on geographies consisting of 485,146,560 people shows a substantial negative correlation between the proportion of Immigrants from South America and labor force participation rate among population between the ages 16 and 19 in the United States with a correlation coefficient (R) of -0.538 and weighted average of 33.3%. Similarly, the statistical analysis conducted on geographies consisting of 112,651,679 people shows a mild positive correlation between the proportion of Bahamians and labor force participation rate among population between the ages 16 and 19 in the United States with a correlation coefficient (R) of 0.309 and weighted average of 34.6%, a difference of 3.9%.
In Labor Force | Age 16-19 Correlation Summary
| Measurement | Immigrants from South America | Bahamian |
| Minimum | 6.8% | 6.3% |
| Maximum | 43.6% | 78.5% |
| Range | 36.8% | 72.2% |
| Mean | 29.4% | 37.1% |
| Median | 30.6% | 34.6% |
| Interquartile 25% (IQ1) | 25.9% | 30.1% |
| Interquartile 75% (IQ3) | 34.2% | 41.2% |
| Interquartile Range (IQR) | 8.3% | 11.1% |
| Standard Deviation (Sample) | 7.6% | 14.4% |
| Standard Deviation (Population) | 7.5% | 14.3% |
Similar Demographics by In Labor Force | Age 16-19
Demographics Similar to Immigrants from South America by In Labor Force | Age 16-19
In terms of in labor force | age 16-19, the demographic groups most similar to Immigrants from South America are Argentinean (33.3%, a difference of 0.020%), Yup'ik (33.3%, a difference of 0.12%), Jamaican (33.2%, a difference of 0.25%), Haitian (33.4%, a difference of 0.32%), and Immigrants from Haiti (33.2%, a difference of 0.34%).
| Demographics | Rating | Rank | In Labor Force | Age 16-19 |
| South Americans | 0.2 /100 | #286 | Tragic 33.6% |
| Nepalese | 0.1 /100 | #287 | Tragic 33.5% |
| Immigrants | Indonesia | 0.1 /100 | #288 | Tragic 33.5% |
| Immigrants | Singapore | 0.1 /100 | #289 | Tragic 33.5% |
| Immigrants | Colombia | 0.1 /100 | #290 | Tragic 33.5% |
| Immigrants | Belarus | 0.1 /100 | #291 | Tragic 33.4% |
| Haitians | 0.1 /100 | #292 | Tragic 33.4% |
| Immigrants | South America | 0.1 /100 | #293 | Tragic 33.3% |
| Argentineans | 0.1 /100 | #294 | Tragic 33.3% |
| Yup'ik | 0.1 /100 | #295 | Tragic 33.3% |
| Jamaicans | 0.1 /100 | #296 | Tragic 33.2% |
| Immigrants | Haiti | 0.1 /100 | #297 | Tragic 33.2% |
| Iranians | 0.0 /100 | #298 | Tragic 33.0% |
| Armenians | 0.0 /100 | #299 | Tragic 32.9% |
| Immigrants | Argentina | 0.0 /100 | #300 | Tragic 32.9% |
Demographics Similar to Bahamians by In Labor Force | Age 16-19
In terms of in labor force | age 16-19, the demographic groups most similar to Bahamians are Peruvian (34.6%, a difference of 0.040%), Immigrants from Japan (34.7%, a difference of 0.12%), Immigrants from South Central Asia (34.6%, a difference of 0.15%), Immigrants from Egypt (34.6%, a difference of 0.15%), and Thai (34.6%, a difference of 0.16%).
| Demographics | Rating | Rank | In Labor Force | Age 16-19 |
| Laotians | 2.4 /100 | #247 | Tragic 34.9% |
| Central Americans | 2.2 /100 | #248 | Tragic 34.8% |
| Immigrants | Ukraine | 2.2 /100 | #249 | Tragic 34.8% |
| Immigrants | Pakistan | 2.0 /100 | #250 | Tragic 34.8% |
| Immigrants | Western Asia | 2.0 /100 | #251 | Tragic 34.8% |
| Immigrants | Chile | 2.0 /100 | #252 | Tragic 34.8% |
| Immigrants | Japan | 1.5 /100 | #253 | Tragic 34.7% |
| Bahamians | 1.4 /100 | #254 | Tragic 34.6% |
| Peruvians | 1.4 /100 | #255 | Tragic 34.6% |
| Immigrants | South Central Asia | 1.3 /100 | #256 | Tragic 34.6% |
| Immigrants | Egypt | 1.2 /100 | #257 | Tragic 34.6% |
| Thais | 1.2 /100 | #258 | Tragic 34.6% |
| Immigrants | Immigrants | 1.2 /100 | #259 | Tragic 34.6% |
| Egyptians | 1.2 /100 | #260 | Tragic 34.5% |
| Salvadorans | 1.1 /100 | #261 | Tragic 34.5% |