Immigrants from Congo vs Soviet Union In Labor Force | Age 16-19
COMPARE
Immigrants from Congo
Soviet Union
In Labor Force | Age 16-19
In Labor Force | Age 16-19 Comparison
Immigrants from Congo
Soviet Union
41.7%
IN LABOR FORCE | AGE 16-19
100.0/ 100
METRIC RATING
37th/ 347
METRIC RANK
31.4%
IN LABOR FORCE | AGE 16-19
0.0/ 100
METRIC RATING
319th/ 347
METRIC RANK
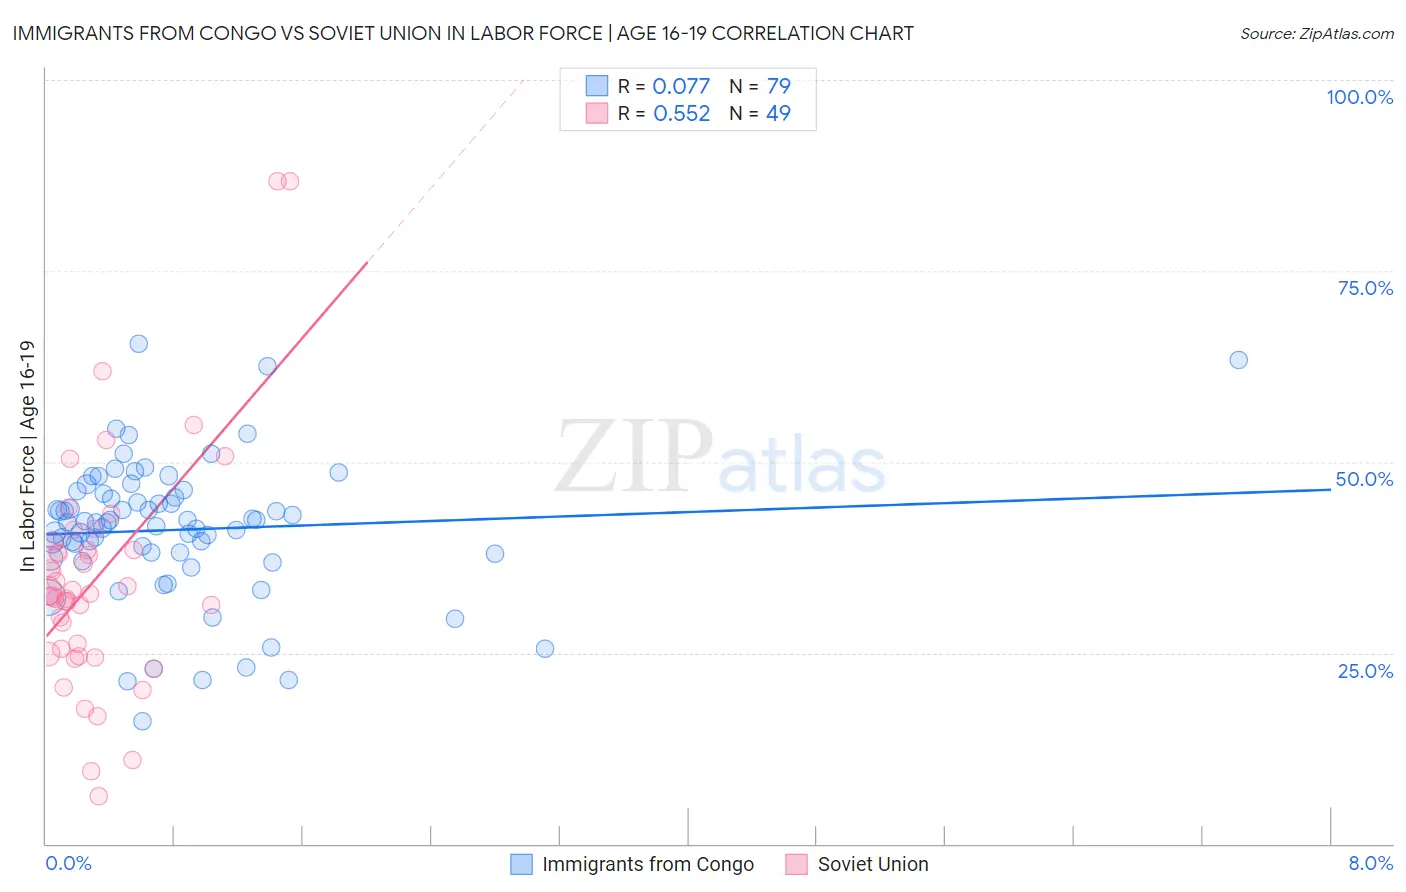
Immigrants from Congo vs Soviet Union In Labor Force | Age 16-19 Correlation Chart
The statistical analysis conducted on geographies consisting of 92,123,036 people shows a slight positive correlation between the proportion of Immigrants from Congo and labor force participation rate among population between the ages 16 and 19 in the United States with a correlation coefficient (R) of 0.077 and weighted average of 41.7%. Similarly, the statistical analysis conducted on geographies consisting of 43,506,709 people shows a substantial positive correlation between the proportion of Soviet Union and labor force participation rate among population between the ages 16 and 19 in the United States with a correlation coefficient (R) of 0.552 and weighted average of 31.4%, a difference of 32.7%.
In Labor Force | Age 16-19 Correlation Summary
| Measurement | Immigrants from Congo | Soviet Union |
| Minimum | 16.1% | 6.3% |
| Maximum | 65.5% | 86.7% |
| Range | 49.4% | 80.4% |
| Mean | 41.1% | 34.8% |
| Median | 42.1% | 32.7% |
| Interquartile 25% (IQ1) | 37.9% | 25.2% |
| Interquartile 75% (IQ3) | 45.9% | 39.1% |
| Interquartile Range (IQR) | 8.0% | 13.9% |
| Standard Deviation (Sample) | 9.1% | 15.5% |
| Standard Deviation (Population) | 9.1% | 15.4% |
Similar Demographics by In Labor Force | Age 16-19
Demographics Similar to Immigrants from Congo by In Labor Force | Age 16-19
In terms of in labor force | age 16-19, the demographic groups most similar to Immigrants from Congo are Immigrants from the Azores (41.7%, a difference of 0.080%), Yugoslavian (41.8%, a difference of 0.22%), Immigrants from Bosnia and Herzegovina (41.8%, a difference of 0.24%), Liberian (41.8%, a difference of 0.32%), and Sioux (41.5%, a difference of 0.35%).
| Demographics | Rating | Rank | In Labor Force | Age 16-19 |
| Scottish | 100.0 /100 | #30 | Exceptional 42.0% |
| Irish | 100.0 /100 | #31 | Exceptional 42.0% |
| Czechoslovakians | 100.0 /100 | #32 | Exceptional 41.9% |
| Liberians | 100.0 /100 | #33 | Exceptional 41.8% |
| Immigrants | Bosnia and Herzegovina | 100.0 /100 | #34 | Exceptional 41.8% |
| Yugoslavians | 100.0 /100 | #35 | Exceptional 41.8% |
| Immigrants | Azores | 100.0 /100 | #36 | Exceptional 41.7% |
| Immigrants | Congo | 100.0 /100 | #37 | Exceptional 41.7% |
| Sioux | 100.0 /100 | #38 | Exceptional 41.5% |
| Scotch-Irish | 100.0 /100 | #39 | Exceptional 41.5% |
| Immigrants | Liberia | 100.0 /100 | #40 | Exceptional 41.5% |
| Celtics | 100.0 /100 | #41 | Exceptional 41.3% |
| Whites/Caucasians | 100.0 /100 | #42 | Exceptional 41.3% |
| Tongans | 100.0 /100 | #43 | Exceptional 41.2% |
| Europeans | 100.0 /100 | #44 | Exceptional 41.1% |
Demographics Similar to Soviet Union by In Labor Force | Age 16-19
In terms of in labor force | age 16-19, the demographic groups most similar to Soviet Union are Ecuadorian (31.4%, a difference of 0.060%), West Indian (31.3%, a difference of 0.30%), Immigrants from Yemen (31.5%, a difference of 0.32%), Tohono O'odham (31.3%, a difference of 0.41%), and Immigrants from Caribbean (31.2%, a difference of 0.54%).
| Demographics | Rating | Rank | In Labor Force | Age 16-19 |
| Immigrants | Belize | 0.0 /100 | #312 | Tragic 31.8% |
| Hopi | 0.0 /100 | #313 | Tragic 31.8% |
| Cubans | 0.0 /100 | #314 | Tragic 31.8% |
| Immigrants | West Indies | 0.0 /100 | #315 | Tragic 31.7% |
| Filipinos | 0.0 /100 | #316 | Tragic 31.7% |
| Immigrants | Nicaragua | 0.0 /100 | #317 | Tragic 31.6% |
| Immigrants | Yemen | 0.0 /100 | #318 | Tragic 31.5% |
| Soviet Union | 0.0 /100 | #319 | Tragic 31.4% |
| Ecuadorians | 0.0 /100 | #320 | Tragic 31.4% |
| West Indians | 0.0 /100 | #321 | Tragic 31.3% |
| Tohono O'odham | 0.0 /100 | #322 | Tragic 31.3% |
| Immigrants | Caribbean | 0.0 /100 | #323 | Tragic 31.2% |
| Dominicans | 0.0 /100 | #324 | Tragic 31.2% |
| Immigrants | China | 0.0 /100 | #325 | Tragic 31.1% |
| Immigrants | Dominican Republic | 0.0 /100 | #326 | Tragic 31.1% |