Jamaican vs Soviet Union In Labor Force | Age 16-19
COMPARE
Jamaican
Soviet Union
In Labor Force | Age 16-19
In Labor Force | Age 16-19 Comparison
Jamaicans
Soviet Union
33.2%
IN LABOR FORCE | AGE 16-19
0.1/ 100
METRIC RATING
296th/ 347
METRIC RANK
31.4%
IN LABOR FORCE | AGE 16-19
0.0/ 100
METRIC RATING
319th/ 347
METRIC RANK
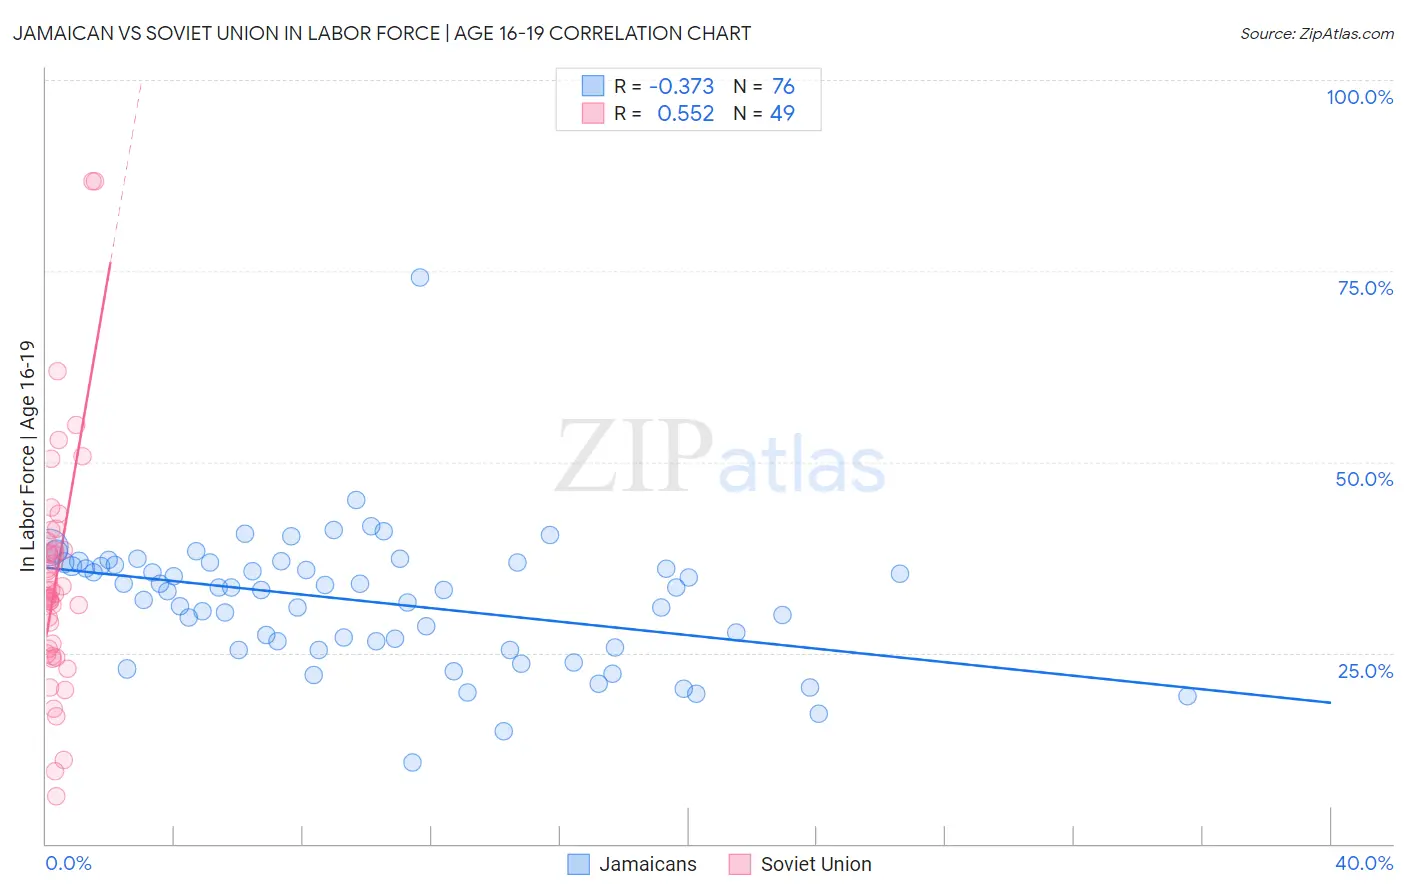
Jamaican vs Soviet Union In Labor Force | Age 16-19 Correlation Chart
The statistical analysis conducted on geographies consisting of 367,624,466 people shows a mild negative correlation between the proportion of Jamaicans and labor force participation rate among population between the ages 16 and 19 in the United States with a correlation coefficient (R) of -0.373 and weighted average of 33.2%. Similarly, the statistical analysis conducted on geographies consisting of 43,506,709 people shows a substantial positive correlation between the proportion of Soviet Union and labor force participation rate among population between the ages 16 and 19 in the United States with a correlation coefficient (R) of 0.552 and weighted average of 31.4%, a difference of 5.7%.
In Labor Force | Age 16-19 Correlation Summary
| Measurement | Jamaican | Soviet Union |
| Minimum | 10.6% | 6.3% |
| Maximum | 74.2% | 86.7% |
| Range | 63.6% | 80.4% |
| Mean | 31.7% | 34.8% |
| Median | 33.4% | 32.7% |
| Interquartile 25% (IQ1) | 26.1% | 25.2% |
| Interquartile 75% (IQ3) | 36.6% | 39.1% |
| Interquartile Range (IQR) | 10.5% | 13.9% |
| Standard Deviation (Sample) | 8.7% | 15.5% |
| Standard Deviation (Population) | 8.6% | 15.4% |
Similar Demographics by In Labor Force | Age 16-19
Demographics Similar to Jamaicans by In Labor Force | Age 16-19
In terms of in labor force | age 16-19, the demographic groups most similar to Jamaicans are Immigrants from Haiti (33.2%, a difference of 0.090%), Yup'ik (33.3%, a difference of 0.13%), Argentinean (33.3%, a difference of 0.23%), Immigrants from South America (33.3%, a difference of 0.25%), and Haitian (33.4%, a difference of 0.57%).
| Demographics | Rating | Rank | In Labor Force | Age 16-19 |
| Immigrants | Singapore | 0.1 /100 | #289 | Tragic 33.5% |
| Immigrants | Colombia | 0.1 /100 | #290 | Tragic 33.5% |
| Immigrants | Belarus | 0.1 /100 | #291 | Tragic 33.4% |
| Haitians | 0.1 /100 | #292 | Tragic 33.4% |
| Immigrants | South America | 0.1 /100 | #293 | Tragic 33.3% |
| Argentineans | 0.1 /100 | #294 | Tragic 33.3% |
| Yup'ik | 0.1 /100 | #295 | Tragic 33.3% |
| Jamaicans | 0.1 /100 | #296 | Tragic 33.2% |
| Immigrants | Haiti | 0.1 /100 | #297 | Tragic 33.2% |
| Iranians | 0.0 /100 | #298 | Tragic 33.0% |
| Armenians | 0.0 /100 | #299 | Tragic 32.9% |
| Immigrants | Argentina | 0.0 /100 | #300 | Tragic 32.9% |
| Okinawans | 0.0 /100 | #301 | Tragic 32.8% |
| Belizeans | 0.0 /100 | #302 | Tragic 32.8% |
| Immigrants | Dominica | 0.0 /100 | #303 | Tragic 32.5% |
Demographics Similar to Soviet Union by In Labor Force | Age 16-19
In terms of in labor force | age 16-19, the demographic groups most similar to Soviet Union are Ecuadorian (31.4%, a difference of 0.060%), West Indian (31.3%, a difference of 0.30%), Immigrants from Yemen (31.5%, a difference of 0.32%), Tohono O'odham (31.3%, a difference of 0.41%), and Immigrants from Caribbean (31.2%, a difference of 0.54%).
| Demographics | Rating | Rank | In Labor Force | Age 16-19 |
| Immigrants | Belize | 0.0 /100 | #312 | Tragic 31.8% |
| Hopi | 0.0 /100 | #313 | Tragic 31.8% |
| Cubans | 0.0 /100 | #314 | Tragic 31.8% |
| Immigrants | West Indies | 0.0 /100 | #315 | Tragic 31.7% |
| Filipinos | 0.0 /100 | #316 | Tragic 31.7% |
| Immigrants | Nicaragua | 0.0 /100 | #317 | Tragic 31.6% |
| Immigrants | Yemen | 0.0 /100 | #318 | Tragic 31.5% |
| Soviet Union | 0.0 /100 | #319 | Tragic 31.4% |
| Ecuadorians | 0.0 /100 | #320 | Tragic 31.4% |
| West Indians | 0.0 /100 | #321 | Tragic 31.3% |
| Tohono O'odham | 0.0 /100 | #322 | Tragic 31.3% |
| Immigrants | Caribbean | 0.0 /100 | #323 | Tragic 31.2% |
| Dominicans | 0.0 /100 | #324 | Tragic 31.2% |
| Immigrants | China | 0.0 /100 | #325 | Tragic 31.1% |
| Immigrants | Dominican Republic | 0.0 /100 | #326 | Tragic 31.1% |