Immigrants from Poland vs Immigrants from Saudi Arabia In Labor Force | Age 30-34
COMPARE
Immigrants from Poland
Immigrants from Saudi Arabia
In Labor Force | Age 30-34
In Labor Force | Age 30-34 Comparison
Immigrants from Poland
Immigrants from Saudi Arabia
85.5%
IN LABOR FORCE | AGE 30-34
99.5/ 100
METRIC RATING
59th/ 347
METRIC RANK
84.9%
IN LABOR FORCE | AGE 30-34
76.6/ 100
METRIC RATING
146th/ 347
METRIC RANK
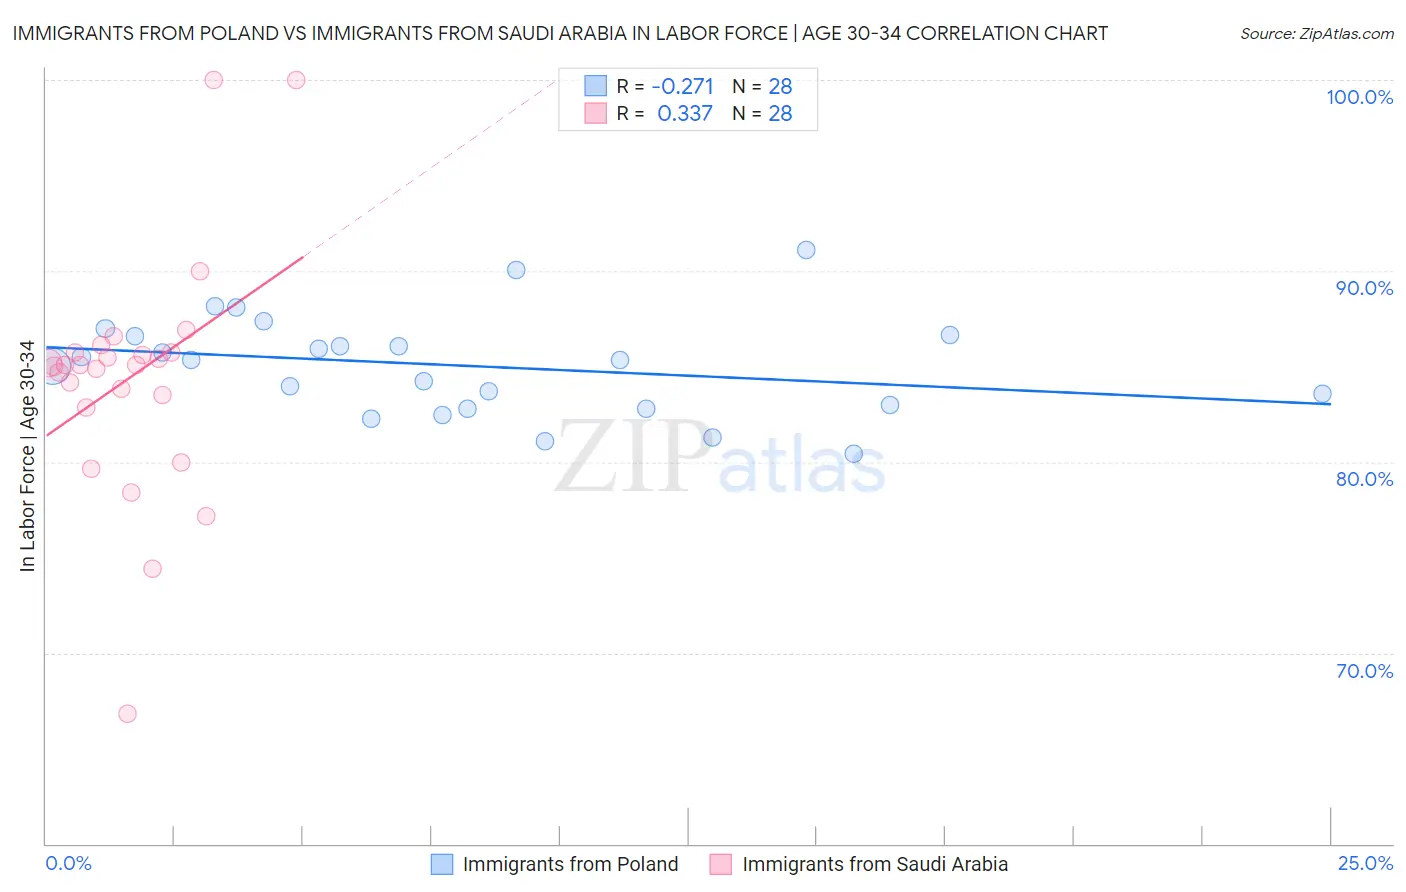
Immigrants from Poland vs Immigrants from Saudi Arabia In Labor Force | Age 30-34 Correlation Chart
The statistical analysis conducted on geographies consisting of 304,756,662 people shows a weak negative correlation between the proportion of Immigrants from Poland and labor force participation rate among population between the ages 30 and 34 in the United States with a correlation coefficient (R) of -0.271 and weighted average of 85.5%. Similarly, the statistical analysis conducted on geographies consisting of 164,216,208 people shows a mild positive correlation between the proportion of Immigrants from Saudi Arabia and labor force participation rate among population between the ages 30 and 34 in the United States with a correlation coefficient (R) of 0.337 and weighted average of 84.9%, a difference of 0.74%.
In Labor Force | Age 30-34 Correlation Summary
| Measurement | Immigrants from Poland | Immigrants from Saudi Arabia |
| Minimum | 80.4% | 66.8% |
| Maximum | 91.1% | 100.0% |
| Range | 10.7% | 33.2% |
| Mean | 85.0% | 84.4% |
| Median | 85.3% | 85.1% |
| Interquartile 25% (IQ1) | 82.9% | 83.2% |
| Interquartile 75% (IQ3) | 86.6% | 85.7% |
| Interquartile Range (IQR) | 3.7% | 2.5% |
| Standard Deviation (Sample) | 2.6% | 6.3% |
| Standard Deviation (Population) | 2.6% | 6.2% |
Similar Demographics by In Labor Force | Age 30-34
Demographics Similar to Immigrants from Poland by In Labor Force | Age 30-34
In terms of in labor force | age 30-34, the demographic groups most similar to Immigrants from Poland are Polish (85.5%, a difference of 0.010%), Immigrants from Turkey (85.5%, a difference of 0.020%), Czech (85.5%, a difference of 0.020%), Russian (85.5%, a difference of 0.020%), and Immigrants from France (85.5%, a difference of 0.020%).
| Demographics | Rating | Rank | In Labor Force | Age 30-34 |
| Slovenes | 99.7 /100 | #52 | Exceptional 85.6% |
| Filipinos | 99.6 /100 | #53 | Exceptional 85.5% |
| Immigrants | Kenya | 99.6 /100 | #54 | Exceptional 85.5% |
| Immigrants | Turkey | 99.6 /100 | #55 | Exceptional 85.5% |
| Czechs | 99.6 /100 | #56 | Exceptional 85.5% |
| Russians | 99.6 /100 | #57 | Exceptional 85.5% |
| Poles | 99.6 /100 | #58 | Exceptional 85.5% |
| Immigrants | Poland | 99.5 /100 | #59 | Exceptional 85.5% |
| Immigrants | France | 99.5 /100 | #60 | Exceptional 85.5% |
| Immigrants | Brazil | 99.5 /100 | #61 | Exceptional 85.5% |
| Soviet Union | 99.4 /100 | #62 | Exceptional 85.5% |
| Macedonians | 99.4 /100 | #63 | Exceptional 85.5% |
| Italians | 99.4 /100 | #64 | Exceptional 85.4% |
| Senegalese | 99.4 /100 | #65 | Exceptional 85.4% |
| Ghanaians | 99.4 /100 | #66 | Exceptional 85.4% |
Demographics Similar to Immigrants from Saudi Arabia by In Labor Force | Age 30-34
In terms of in labor force | age 30-34, the demographic groups most similar to Immigrants from Saudi Arabia are Immigrants from Colombia (84.9%, a difference of 0.0%), Immigrants from Pakistan (84.9%, a difference of 0.0%), Palestinian (84.9%, a difference of 0.010%), Immigrants from Ukraine (84.8%, a difference of 0.010%), and German (84.8%, a difference of 0.010%).
| Demographics | Rating | Rank | In Labor Force | Age 30-34 |
| Bhutanese | 87.5 /100 | #139 | Excellent 85.0% |
| Immigrants | Vietnam | 86.5 /100 | #140 | Excellent 85.0% |
| Chileans | 85.3 /100 | #141 | Excellent 84.9% |
| Immigrants | Indonesia | 84.3 /100 | #142 | Excellent 84.9% |
| Colombians | 82.2 /100 | #143 | Excellent 84.9% |
| Uruguayans | 78.5 /100 | #144 | Good 84.9% |
| Palestinians | 77.7 /100 | #145 | Good 84.9% |
| Immigrants | Saudi Arabia | 76.6 /100 | #146 | Good 84.9% |
| Immigrants | Colombia | 76.3 /100 | #147 | Good 84.9% |
| Immigrants | Pakistan | 76.2 /100 | #148 | Good 84.9% |
| Immigrants | Ukraine | 75.1 /100 | #149 | Good 84.8% |
| Germans | 75.1 /100 | #150 | Good 84.8% |
| Immigrants | Senegal | 74.0 /100 | #151 | Good 84.8% |
| Romanians | 73.5 /100 | #152 | Good 84.8% |
| Syrians | 70.1 /100 | #153 | Good 84.8% |