Immigrants from Philippines vs South African In Labor Force | Age 25-29
COMPARE
Immigrants from Philippines
South African
In Labor Force | Age 25-29
In Labor Force | Age 25-29 Comparison
Immigrants from Philippines
South Africans
84.2%
IN LABOR FORCE | AGE 25-29
4.7/ 100
METRIC RATING
231st/ 347
METRIC RANK
85.0%
IN LABOR FORCE | AGE 25-29
88.9/ 100
METRIC RATING
115th/ 347
METRIC RANK
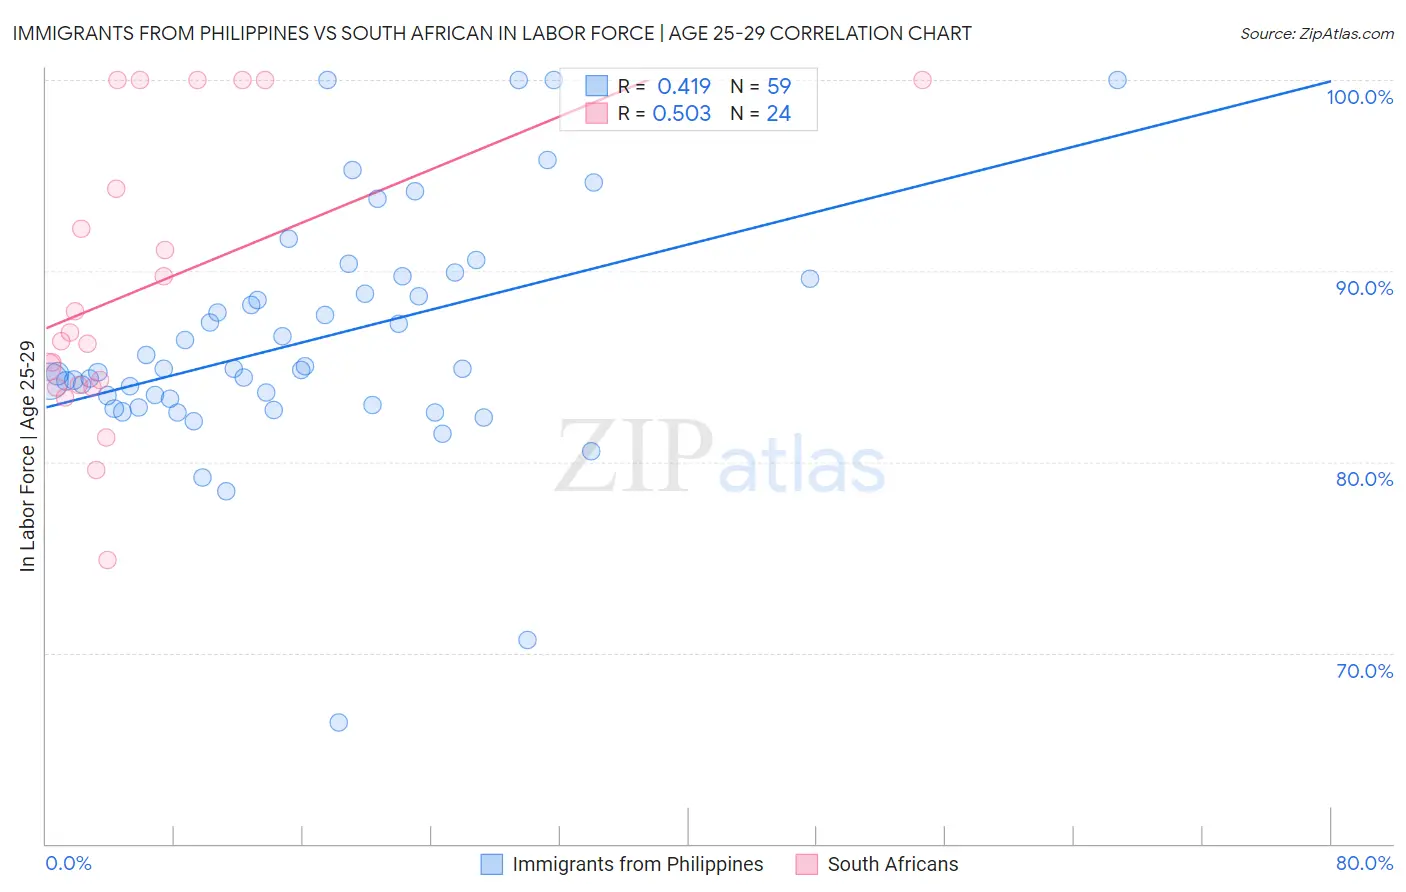
Immigrants from Philippines vs South African In Labor Force | Age 25-29 Correlation Chart
The statistical analysis conducted on geographies consisting of 471,084,239 people shows a moderate positive correlation between the proportion of Immigrants from Philippines and labor force participation rate among population between the ages 25 and 29 in the United States with a correlation coefficient (R) of 0.419 and weighted average of 84.2%. Similarly, the statistical analysis conducted on geographies consisting of 182,558,179 people shows a substantial positive correlation between the proportion of South Africans and labor force participation rate among population between the ages 25 and 29 in the United States with a correlation coefficient (R) of 0.503 and weighted average of 85.0%, a difference of 0.94%.
In Labor Force | Age 25-29 Correlation Summary
| Measurement | Immigrants from Philippines | South African |
| Minimum | 66.4% | 74.9% |
| Maximum | 100.0% | 100.0% |
| Range | 33.6% | 25.1% |
| Mean | 86.4% | 89.2% |
| Median | 84.9% | 86.5% |
| Interquartile 25% (IQ1) | 83.0% | 84.0% |
| Interquartile 75% (IQ3) | 89.6% | 97.2% |
| Interquartile Range (IQR) | 6.6% | 13.2% |
| Standard Deviation (Sample) | 6.2% | 7.5% |
| Standard Deviation (Population) | 6.2% | 7.4% |
Similar Demographics by In Labor Force | Age 25-29
Demographics Similar to Immigrants from Philippines by In Labor Force | Age 25-29
In terms of in labor force | age 25-29, the demographic groups most similar to Immigrants from Philippines are Immigrants from Oceania (84.2%, a difference of 0.010%), White/Caucasian (84.2%, a difference of 0.010%), Panamanian (84.2%, a difference of 0.010%), French American Indian (84.2%, a difference of 0.030%), and Immigrants from Panama (84.2%, a difference of 0.030%).
| Demographics | Rating | Rank | In Labor Force | Age 25-29 |
| Immigrants | West Indies | 6.0 /100 | #224 | Tragic 84.2% |
| Koreans | 5.9 /100 | #225 | Tragic 84.2% |
| Immigrants | Congo | 5.8 /100 | #226 | Tragic 84.2% |
| French American Indians | 5.5 /100 | #227 | Tragic 84.2% |
| Immigrants | Panama | 5.5 /100 | #228 | Tragic 84.2% |
| Immigrants | Oceania | 5.0 /100 | #229 | Tragic 84.2% |
| Whites/Caucasians | 4.8 /100 | #230 | Tragic 84.2% |
| Immigrants | Philippines | 4.7 /100 | #231 | Tragic 84.2% |
| Panamanians | 4.5 /100 | #232 | Tragic 84.2% |
| Immigrants | Western Asia | 2.7 /100 | #233 | Tragic 84.1% |
| Barbadians | 1.0 /100 | #234 | Tragic 83.9% |
| Iraqis | 0.9 /100 | #235 | Tragic 83.9% |
| Guamanians/Chamorros | 0.9 /100 | #236 | Tragic 83.9% |
| Immigrants | Immigrants | 0.9 /100 | #237 | Tragic 83.9% |
| Immigrants | Uzbekistan | 0.8 /100 | #238 | Tragic 83.9% |
Demographics Similar to South Africans by In Labor Force | Age 25-29
In terms of in labor force | age 25-29, the demographic groups most similar to South Africans are Chilean (85.0%, a difference of 0.0%), Immigrants from Belarus (85.0%, a difference of 0.020%), Finnish (85.0%, a difference of 0.020%), Irish (85.0%, a difference of 0.030%), and Immigrants from Malaysia (85.0%, a difference of 0.030%).
| Demographics | Rating | Rank | In Labor Force | Age 25-29 |
| Immigrants | Austria | 91.9 /100 | #108 | Exceptional 85.0% |
| Costa Ricans | 91.9 /100 | #109 | Exceptional 85.0% |
| New Zealanders | 91.5 /100 | #110 | Exceptional 85.0% |
| Immigrants | Middle Africa | 91.4 /100 | #111 | Exceptional 85.0% |
| Senegalese | 90.9 /100 | #112 | Exceptional 85.0% |
| Irish | 90.6 /100 | #113 | Exceptional 85.0% |
| Immigrants | Malaysia | 90.4 /100 | #114 | Exceptional 85.0% |
| South Africans | 88.9 /100 | #115 | Excellent 85.0% |
| Chileans | 88.8 /100 | #116 | Excellent 85.0% |
| Immigrants | Belarus | 88.0 /100 | #117 | Excellent 85.0% |
| Finns | 87.8 /100 | #118 | Excellent 85.0% |
| Filipinos | 87.1 /100 | #119 | Excellent 84.9% |
| Immigrants | South Africa | 86.1 /100 | #120 | Excellent 84.9% |
| Immigrants | Chile | 85.6 /100 | #121 | Excellent 84.9% |
| Scandinavians | 85.1 /100 | #122 | Excellent 84.9% |