Immigrants from Philippines vs English In Labor Force | Age 25-29
COMPARE
Immigrants from Philippines
English
In Labor Force | Age 25-29
In Labor Force | Age 25-29 Comparison
Immigrants from Philippines
English
84.2%
IN LABOR FORCE | AGE 25-29
4.7/ 100
METRIC RATING
231st/ 347
METRIC RANK
84.5%
IN LABOR FORCE | AGE 25-29
25.8/ 100
METRIC RATING
192nd/ 347
METRIC RANK
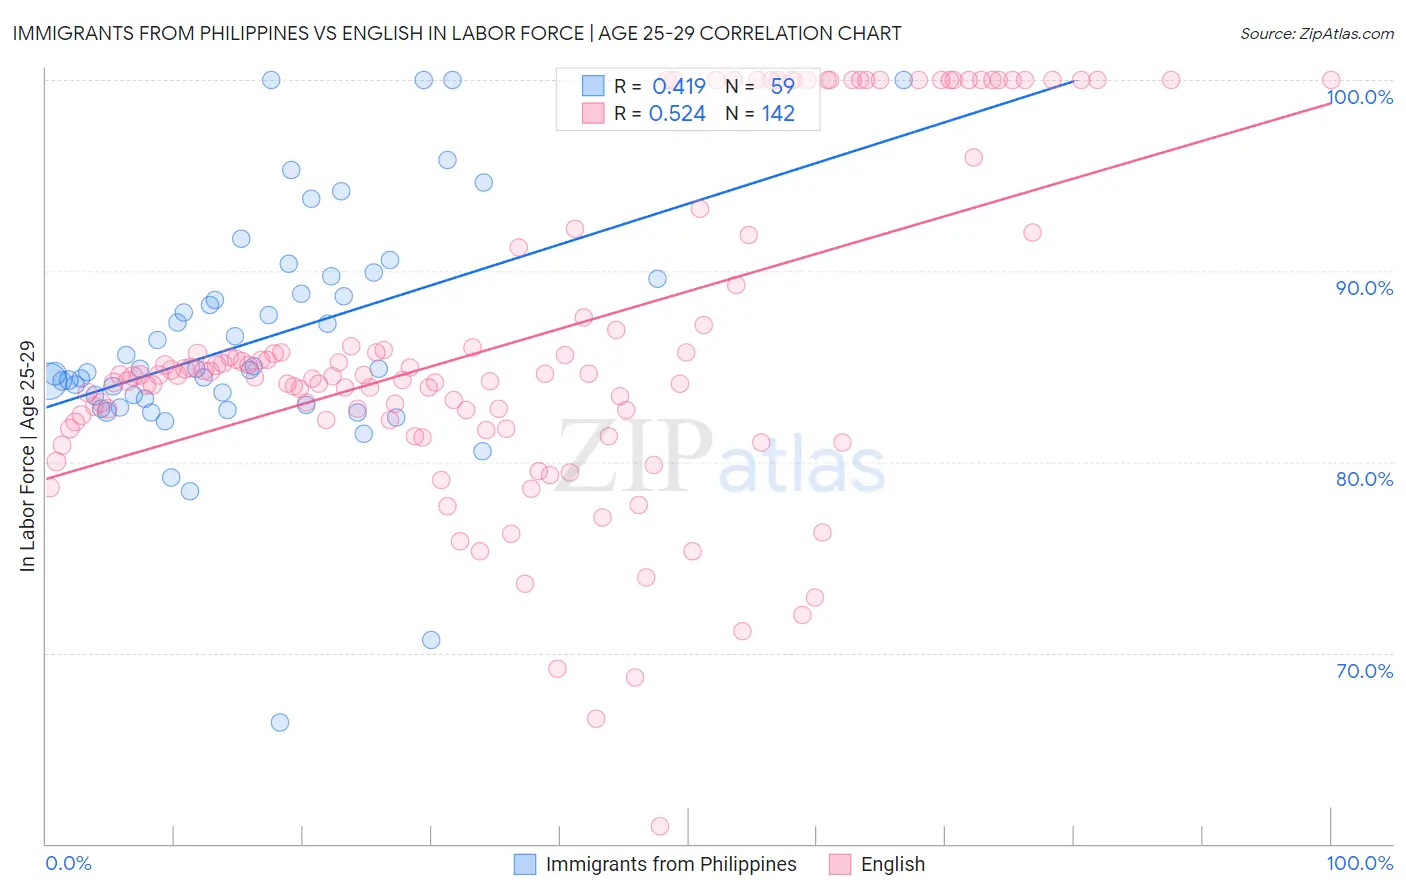
Immigrants from Philippines vs English In Labor Force | Age 25-29 Correlation Chart
The statistical analysis conducted on geographies consisting of 471,084,239 people shows a moderate positive correlation between the proportion of Immigrants from Philippines and labor force participation rate among population between the ages 25 and 29 in the United States with a correlation coefficient (R) of 0.419 and weighted average of 84.2%. Similarly, the statistical analysis conducted on geographies consisting of 577,776,495 people shows a substantial positive correlation between the proportion of English and labor force participation rate among population between the ages 25 and 29 in the United States with a correlation coefficient (R) of 0.524 and weighted average of 84.5%, a difference of 0.36%.
In Labor Force | Age 25-29 Correlation Summary
| Measurement | Immigrants from Philippines | English |
| Minimum | 66.4% | 60.9% |
| Maximum | 100.0% | 100.0% |
| Range | 33.6% | 39.1% |
| Mean | 86.4% | 86.4% |
| Median | 84.9% | 84.5% |
| Interquartile 25% (IQ1) | 83.0% | 82.2% |
| Interquartile 75% (IQ3) | 89.6% | 91.9% |
| Interquartile Range (IQR) | 6.6% | 9.7% |
| Standard Deviation (Sample) | 6.2% | 8.6% |
| Standard Deviation (Population) | 6.2% | 8.6% |
Similar Demographics by In Labor Force | Age 25-29
Demographics Similar to Immigrants from Philippines by In Labor Force | Age 25-29
In terms of in labor force | age 25-29, the demographic groups most similar to Immigrants from Philippines are Immigrants from Oceania (84.2%, a difference of 0.010%), White/Caucasian (84.2%, a difference of 0.010%), Panamanian (84.2%, a difference of 0.010%), French American Indian (84.2%, a difference of 0.030%), and Immigrants from Panama (84.2%, a difference of 0.030%).
| Demographics | Rating | Rank | In Labor Force | Age 25-29 |
| Immigrants | West Indies | 6.0 /100 | #224 | Tragic 84.2% |
| Koreans | 5.9 /100 | #225 | Tragic 84.2% |
| Immigrants | Congo | 5.8 /100 | #226 | Tragic 84.2% |
| French American Indians | 5.5 /100 | #227 | Tragic 84.2% |
| Immigrants | Panama | 5.5 /100 | #228 | Tragic 84.2% |
| Immigrants | Oceania | 5.0 /100 | #229 | Tragic 84.2% |
| Whites/Caucasians | 4.8 /100 | #230 | Tragic 84.2% |
| Immigrants | Philippines | 4.7 /100 | #231 | Tragic 84.2% |
| Panamanians | 4.5 /100 | #232 | Tragic 84.2% |
| Immigrants | Western Asia | 2.7 /100 | #233 | Tragic 84.1% |
| Barbadians | 1.0 /100 | #234 | Tragic 83.9% |
| Iraqis | 0.9 /100 | #235 | Tragic 83.9% |
| Guamanians/Chamorros | 0.9 /100 | #236 | Tragic 83.9% |
| Immigrants | Immigrants | 0.9 /100 | #237 | Tragic 83.9% |
| Immigrants | Uzbekistan | 0.8 /100 | #238 | Tragic 83.9% |
Demographics Similar to English by In Labor Force | Age 25-29
In terms of in labor force | age 25-29, the demographic groups most similar to English are South American Indian (84.5%, a difference of 0.010%), Zimbabwean (84.5%, a difference of 0.030%), Welsh (84.5%, a difference of 0.050%), Portuguese (84.4%, a difference of 0.050%), and Immigrants from Israel (84.4%, a difference of 0.050%).
| Demographics | Rating | Rank | In Labor Force | Age 25-29 |
| Immigrants | Denmark | 37.0 /100 | #185 | Fair 84.6% |
| Immigrants | Belgium | 35.0 /100 | #186 | Fair 84.6% |
| Immigrants | Portugal | 34.7 /100 | #187 | Fair 84.6% |
| Immigrants | Ukraine | 33.7 /100 | #188 | Fair 84.5% |
| Moroccans | 32.6 /100 | #189 | Fair 84.5% |
| Welsh | 31.1 /100 | #190 | Fair 84.5% |
| Zimbabweans | 28.7 /100 | #191 | Fair 84.5% |
| English | 25.8 /100 | #192 | Fair 84.5% |
| South American Indians | 25.0 /100 | #193 | Fair 84.5% |
| Portuguese | 21.2 /100 | #194 | Fair 84.4% |
| Immigrants | Israel | 20.8 /100 | #195 | Fair 84.4% |
| Immigrants | South Eastern Asia | 19.5 /100 | #196 | Poor 84.4% |
| Tlingit-Haida | 19.3 /100 | #197 | Poor 84.4% |
| Immigrants | Iraq | 19.0 /100 | #198 | Poor 84.4% |
| Immigrants | Germany | 18.3 /100 | #199 | Poor 84.4% |