Immigrants from Jamaica vs South African In Labor Force | Age 25-29
COMPARE
Immigrants from Jamaica
South African
In Labor Force | Age 25-29
In Labor Force | Age 25-29 Comparison
Immigrants from Jamaica
South Africans
83.8%
IN LABOR FORCE | AGE 25-29
0.4/ 100
METRIC RATING
244th/ 347
METRIC RANK
85.0%
IN LABOR FORCE | AGE 25-29
88.9/ 100
METRIC RATING
115th/ 347
METRIC RANK
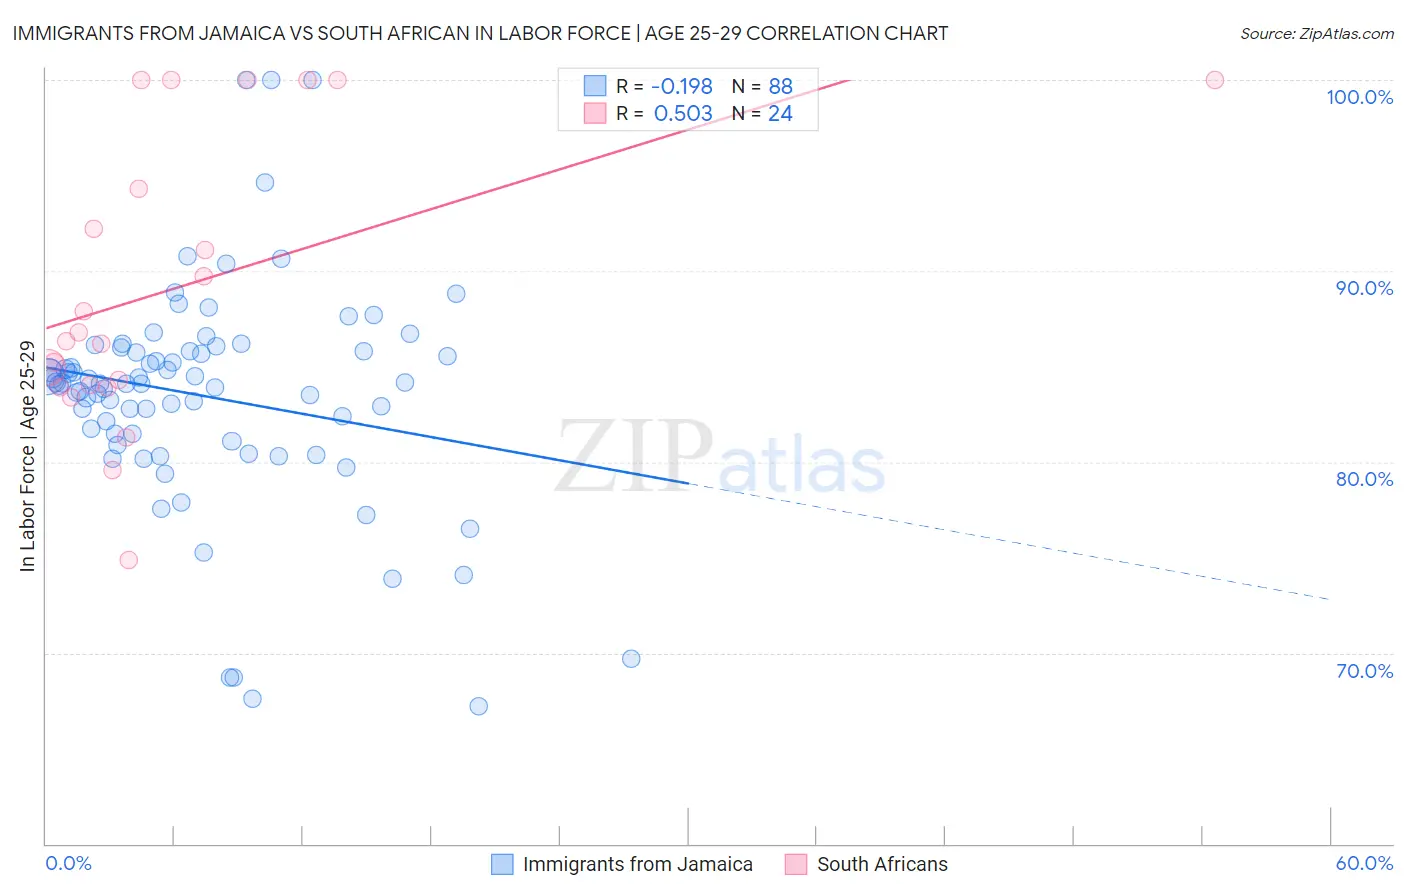
Immigrants from Jamaica vs South African In Labor Force | Age 25-29 Correlation Chart
The statistical analysis conducted on geographies consisting of 301,725,989 people shows a poor negative correlation between the proportion of Immigrants from Jamaica and labor force participation rate among population between the ages 25 and 29 in the United States with a correlation coefficient (R) of -0.198 and weighted average of 83.8%. Similarly, the statistical analysis conducted on geographies consisting of 182,558,179 people shows a substantial positive correlation between the proportion of South Africans and labor force participation rate among population between the ages 25 and 29 in the United States with a correlation coefficient (R) of 0.503 and weighted average of 85.0%, a difference of 1.4%.
In Labor Force | Age 25-29 Correlation Summary
| Measurement | Immigrants from Jamaica | South African |
| Minimum | 67.2% | 74.9% |
| Maximum | 100.0% | 100.0% |
| Range | 32.8% | 25.1% |
| Mean | 83.4% | 89.2% |
| Median | 84.1% | 86.5% |
| Interquartile 25% (IQ1) | 81.3% | 84.0% |
| Interquartile 75% (IQ3) | 85.8% | 97.2% |
| Interquartile Range (IQR) | 4.5% | 13.2% |
| Standard Deviation (Sample) | 5.9% | 7.5% |
| Standard Deviation (Population) | 5.9% | 7.4% |
Similar Demographics by In Labor Force | Age 25-29
Demographics Similar to Immigrants from Jamaica by In Labor Force | Age 25-29
In terms of in labor force | age 25-29, the demographic groups most similar to Immigrants from Jamaica are Iroquois (83.8%, a difference of 0.0%), Salvadoran (83.8%, a difference of 0.040%), U.S. Virgin Islander (83.8%, a difference of 0.050%), Cree (83.8%, a difference of 0.050%), and Immigrants from El Salvador (83.7%, a difference of 0.070%).
| Demographics | Rating | Rank | In Labor Force | Age 25-29 |
| Immigrants | Immigrants | 0.9 /100 | #237 | Tragic 83.9% |
| Immigrants | Uzbekistan | 0.8 /100 | #238 | Tragic 83.9% |
| Jamaicans | 0.8 /100 | #239 | Tragic 83.9% |
| Trinidadians and Tobagonians | 0.7 /100 | #240 | Tragic 83.9% |
| Alsatians | 0.7 /100 | #241 | Tragic 83.9% |
| U.S. Virgin Islanders | 0.6 /100 | #242 | Tragic 83.8% |
| Salvadorans | 0.5 /100 | #243 | Tragic 83.8% |
| Immigrants | Jamaica | 0.4 /100 | #244 | Tragic 83.8% |
| Iroquois | 0.4 /100 | #245 | Tragic 83.8% |
| Cree | 0.3 /100 | #246 | Tragic 83.8% |
| Immigrants | El Salvador | 0.3 /100 | #247 | Tragic 83.7% |
| Immigrants | Nonimmigrants | 0.3 /100 | #248 | Tragic 83.7% |
| Hmong | 0.3 /100 | #249 | Tragic 83.7% |
| Central Americans | 0.2 /100 | #250 | Tragic 83.7% |
| Bahamians | 0.2 /100 | #251 | Tragic 83.7% |
Demographics Similar to South Africans by In Labor Force | Age 25-29
In terms of in labor force | age 25-29, the demographic groups most similar to South Africans are Chilean (85.0%, a difference of 0.0%), Immigrants from Belarus (85.0%, a difference of 0.020%), Finnish (85.0%, a difference of 0.020%), Irish (85.0%, a difference of 0.030%), and Immigrants from Malaysia (85.0%, a difference of 0.030%).
| Demographics | Rating | Rank | In Labor Force | Age 25-29 |
| Immigrants | Austria | 91.9 /100 | #108 | Exceptional 85.0% |
| Costa Ricans | 91.9 /100 | #109 | Exceptional 85.0% |
| New Zealanders | 91.5 /100 | #110 | Exceptional 85.0% |
| Immigrants | Middle Africa | 91.4 /100 | #111 | Exceptional 85.0% |
| Senegalese | 90.9 /100 | #112 | Exceptional 85.0% |
| Irish | 90.6 /100 | #113 | Exceptional 85.0% |
| Immigrants | Malaysia | 90.4 /100 | #114 | Exceptional 85.0% |
| South Africans | 88.9 /100 | #115 | Excellent 85.0% |
| Chileans | 88.8 /100 | #116 | Excellent 85.0% |
| Immigrants | Belarus | 88.0 /100 | #117 | Excellent 85.0% |
| Finns | 87.8 /100 | #118 | Excellent 85.0% |
| Filipinos | 87.1 /100 | #119 | Excellent 84.9% |
| Immigrants | South Africa | 86.1 /100 | #120 | Excellent 84.9% |
| Immigrants | Chile | 85.6 /100 | #121 | Excellent 84.9% |
| Scandinavians | 85.1 /100 | #122 | Excellent 84.9% |