Immigrants from Philippines vs Cuban In Labor Force | Age 25-29

COMPARE

Immigrants from Philippines
Race
Ancestry
AfghanAfricanAlaska NativeAlaskan AthabascanAlbanianAleutAlsatianAmericanApacheArabArapahoArgentineanArmenianAssyrian/Chaldean/SyriacAustralianAustrianBahamianBangladeshiBarbadianBasqueBelgianBelizeanBermudanBhutaneseBlackfeetBolivianBrazilianBritishBritish West IndianBulgarianBurmeseCajunCambodianCanadianCape VerdeanCarpatho RusynCelticCentral AmericanCentral American IndianCherokeeCheyenneChickasawChileanChineseChippewaChoctawColombianColvilleComancheCosta RicanCreeCreekCroatianCrowCypriotCzechCzechoslovakianDanishDelawareDominicanDutchDutch West IndianEastern EuropeanEcuadorianEgyptianEnglishEstonianEthiopianEuropeanFijianFilipinoFinnishFrenchFrench American IndianFrench CanadianGermanGerman RussianGhanaianGreekGuamanian/ChamorroGuatemalanGuyaneseHaitianHmongHonduranHopiHoumaHungarianIcelanderIndian (Asian)IndonesianInupiatIranianIraqiIrishIroquoisIsraeliItalianJamaicanJapaneseJordanianKenyanKiowaKoreanLaotianLatvianLebaneseLiberianLithuanianLumbeeLuxembourgerMacedonianMalaysianMalteseMarshalleseMenomineeMexicanMexican American IndianMongolianMoroccanNative HawaiianNavajoNepaleseNew ZealanderNicaraguanNigerianNorthern EuropeanNorwegianOkinawanOsageOttawaPaiutePakistaniPalestinianPanamanianParaguayanPennsylvania GermanPeruvianPimaPolishPortuguesePotawatomiPuebloPuerto RicanPuget Sound SalishRomanianRussianSalvadoranSamoanScandinavianScotch-IrishScottishSeminoleSenegaleseSerbianShoshoneSierra LeoneanSiouxSlavicSlovakSloveneSomaliSouth AfricanSouth AmericanSouth American IndianSoviet UnionSpaniardSpanishSpanish AmericanSpanish American IndianSri LankanSubsaharan AfricanSudaneseSwedishSwissSyrianTaiwaneseThaiTlingit-HaidaTohono O'OdhamTonganTrinidadian and TobagonianTsimshianTurkishU.S. Virgin IslanderUgandanUkrainianUruguayanUteVenezuelanVietnameseWelshWest IndianYakamaYaquiYugoslavianYumanYup'ikZimbabwean
Immigration
NonimmigrantsImmigrantsAfghanistanAfricaAlbaniaArgentinaArmeniaAsiaAustraliaAustriaBahamasBangladeshBarbadosBelarusBelgiumBelizeBoliviaBosnia and HerzegovinaBrazilBulgariaBurma/MyanmarCabo VerdeCambodiaCameroonCanadaCaribbeanCentral AmericaChileChinaColombiaCongoCosta RicaCroatiaCubaCzechoslovakiaDenmarkDominicaDominican RepublicEastern AfricaEastern AsiaEastern EuropeEcuadorEgyptEl SalvadorEnglandEritreaEthiopiaEuropeFijiFranceGermanyGhanaGreeceGrenadaGuatemalaGuyanaHaitiHondurasHong KongHungaryIndiaIndonesiaIranIraqIrelandIsraelItalyJamaicaJapanJordanKazakhstanKenyaKoreaKuwaitLaosLatin AmericaLatviaLebanonLiberiaLithuaniaMalaysiaMexicoMicronesiaMiddle AfricaMoldovaMoroccoNepalNetherlandsNicaraguaNigeriaNorth AmericaNorth MacedoniaNorthern AfricaNorthern EuropeNorwayOceaniaPakistanPanamaPeruPhilippinesPolandPortugalRomaniaRussiaSaudi ArabiaScotlandSenegalSerbiaSierra LeoneSingaporeSomaliaSouth AfricaSouth AmericaSouth Central AsiaSouth Eastern AsiaSouthern EuropeSpainSri LankaSt. Vincent and the GrenadinesSudanSwedenSwitzerlandSyriaTaiwanThailandTrinidad and TobagoTurkeyUgandaUkraineUruguayUzbekistanVenezuelaVietnamWest IndiesWestern AfricaWestern AsiaWestern EuropeYemenZaireZimbabweAzores
Cuban
Race
Ancestry
AfghanAfricanAlaska NativeAlaskan AthabascanAlbanianAleutAlsatianAmericanApacheArabArapahoArgentineanArmenianAssyrian/Chaldean/SyriacAustralianAustrianBahamianBangladeshiBarbadianBasqueBelgianBelizeanBermudanBhutaneseBlackfeetBolivianBrazilianBritishBritish West IndianBulgarianBurmeseCajunCambodianCanadianCape VerdeanCarpatho RusynCelticCentral AmericanCentral American IndianCherokeeCheyenneChickasawChileanChineseChippewaChoctawColombianColvilleComancheCosta RicanCreeCreekCroatianCrowCubanCypriotCzechCzechoslovakianDanishDelawareDominicanDutchDutch West IndianEastern EuropeanEcuadorianEgyptianEnglishEstonianEthiopianEuropeanFijianFilipinoFinnishFrenchFrench American IndianFrench CanadianGermanGerman RussianGhanaianGreekGuamanian/ChamorroGuatemalanGuyaneseHaitianHmongHonduranHopiHoumaHungarianIcelanderIndian (Asian)IndonesianInupiatIranianIraqiIrishIroquoisIsraeliItalianJamaicanJapaneseJordanianKenyanKiowaKoreanLaotianLatvianLebaneseLiberianLithuanianLumbeeLuxembourgerMacedonianMalaysianMalteseMarshalleseMenomineeMexicanMexican American IndianMongolianMoroccanNative HawaiianNavajoNepaleseNew ZealanderNicaraguanNigerianNorthern EuropeanNorwegianOkinawanOsageOttawaPaiutePakistaniPalestinianPanamanianParaguayanPennsylvania GermanPeruvianPimaPolishPortuguesePotawatomiPuebloPuerto RicanPuget Sound SalishRomanianRussianSalvadoranSamoanScandinavianScotch-IrishScottishSeminoleSenegaleseSerbianShoshoneSierra LeoneanSiouxSlavicSlovakSloveneSomaliSouth AfricanSouth AmericanSouth American IndianSoviet UnionSpaniardSpanishSpanish AmericanSpanish American IndianSri LankanSubsaharan AfricanSudaneseSwedishSwissSyrianTaiwaneseThaiTlingit-HaidaTohono O'OdhamTonganTrinidadian and TobagonianTsimshianTurkishU.S. Virgin IslanderUgandanUkrainianUruguayanUteVenezuelanVietnameseWelshWest IndianYakamaYaquiYugoslavianYumanYup'ikZimbabwean
Immigration
NonimmigrantsImmigrantsAfghanistanAfricaAlbaniaArgentinaArmeniaAsiaAustraliaAustriaBahamasBangladeshBarbadosBelarusBelgiumBelizeBoliviaBosnia and HerzegovinaBrazilBulgariaBurma/MyanmarCabo VerdeCambodiaCameroonCanadaCaribbeanCentral AmericaChileChinaColombiaCongoCosta RicaCroatiaCubaCzechoslovakiaDenmarkDominicaDominican RepublicEastern AfricaEastern AsiaEastern EuropeEcuadorEgyptEl SalvadorEnglandEritreaEthiopiaEuropeFijiFranceGermanyGhanaGreeceGrenadaGuatemalaGuyanaHaitiHondurasHong KongHungaryIndiaIndonesiaIranIraqIrelandIsraelItalyJamaicaJapanJordanKazakhstanKenyaKoreaKuwaitLaosLatin AmericaLatviaLebanonLiberiaLithuaniaMalaysiaMexicoMicronesiaMiddle AfricaMoldovaMoroccoNepalNetherlandsNicaraguaNigeriaNorth AmericaNorth MacedoniaNorthern AfricaNorthern EuropeNorwayOceaniaPakistanPanamaPeruPolandPortugalRomaniaRussiaSaudi ArabiaScotlandSenegalSerbiaSierra LeoneSingaporeSomaliaSouth AfricaSouth AmericaSouth Central AsiaSouth Eastern AsiaSouthern EuropeSpainSri LankaSt. Vincent and the GrenadinesSudanSwedenSwitzerlandSyriaTaiwanThailandTrinidad and TobagoTurkeyUgandaUkraineUruguayUzbekistanVenezuelaVietnamWest IndiesWestern AfricaWestern AsiaWestern EuropeYemenZaireZimbabweAzores
In Labor Force | Age 25-29
Income
Poverty
Unemployment
Labor Participation
Family Structure
Vehicle Availability
Education Level
Disability

In Labor Force | Age 25-29 Comparison

Immigrants from Philippines

Cubans

Tragic
Tragic
84.2%
IN LABOR FORCE | AGE 25-29
4.7/ 100
METRIC RATING
231st/ 347
METRIC RANK
83.5%
IN LABOR FORCE | AGE 25-29
0.1/ 100
METRIC RATING
265th/ 347
METRIC RANK

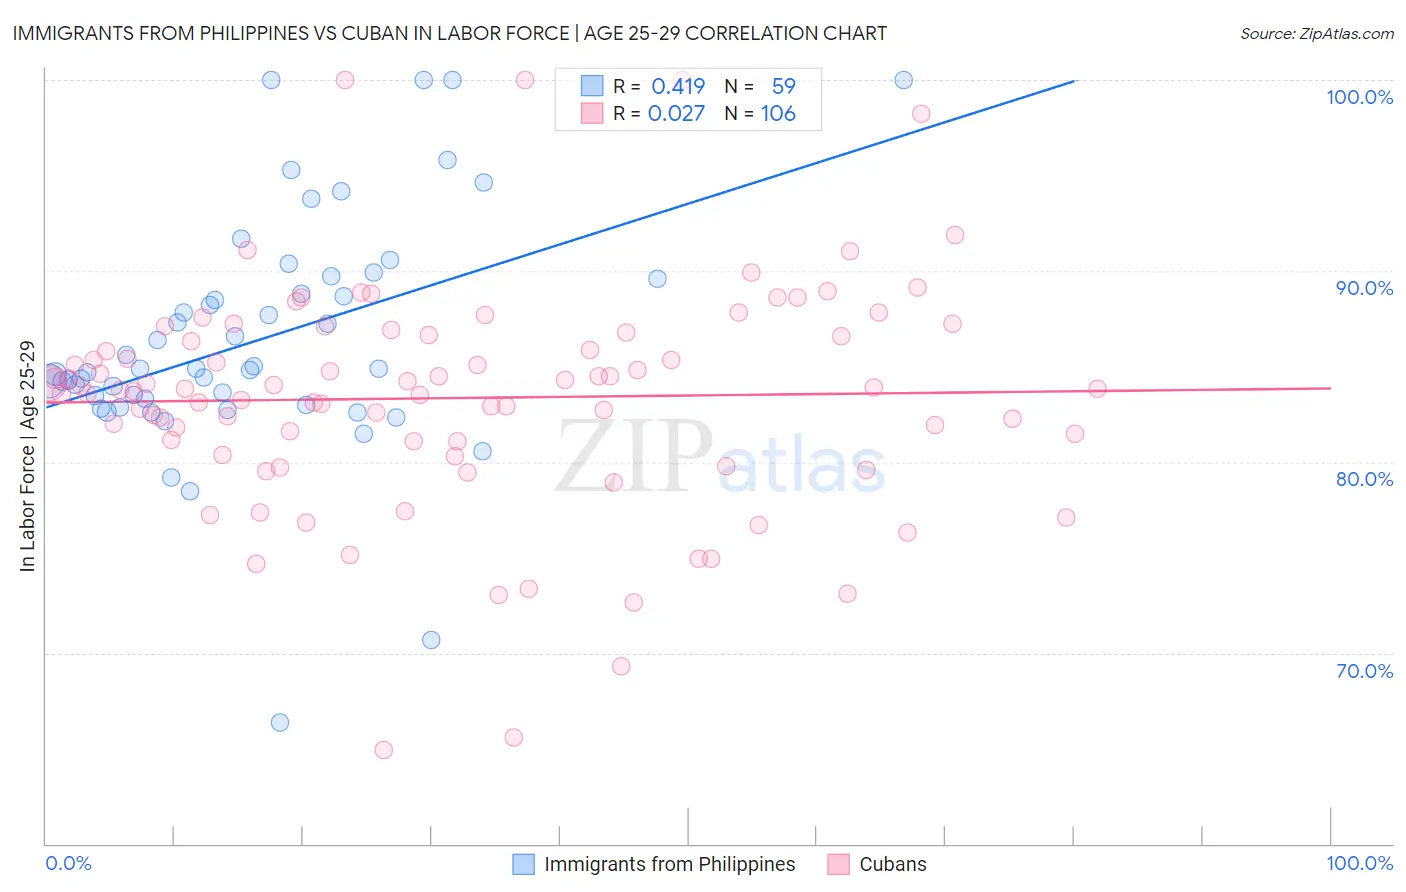
Immigrants from Philippines vs Cuban In Labor Force | Age 25-29 Correlation Chart

The statistical analysis conducted on geographies consisting of 471,084,239 people shows a moderate positive correlation between the proportion of Immigrants from Philippines and labor force participation rate among population between the ages 25 and 29 in the United States with a correlation coefficient (R) of 0.419 and weighted average of 84.2%. Similarly, the statistical analysis conducted on geographies consisting of 449,082,313 people shows no correlation between the proportion of Cubans and labor force participation rate among population between the ages 25 and 29 in the United States with a correlation coefficient (R) of 0.027 and weighted average of 83.5%, a difference of 0.85%.
Immigrants from Philippines vs Cuban In Labor Force | Age 25-29

In Labor Force | Age 25-29 Correlation Summary

MeasurementImmigrants from PhilippinesCuban
Minimum66.4%64.9%
Maximum100.0%100.0%
Range33.6%35.1%
Mean86.4%83.3%
Median84.9%83.8%
Interquartile 25% (IQ1)83.0%81.1%
Interquartile 75% (IQ3)89.6%86.6%
Interquartile Range (IQR)6.6%5.6%
Standard Deviation (Sample)6.2%6.0%
Standard Deviation (Population)6.2%5.9%

Similar Demographics by In Labor Force | Age 25-29

Demographics Similar to Immigrants from Philippines by In Labor Force | Age 25-29

In terms of in labor force | age 25-29, the demographic groups most similar to Immigrants from Philippines are Immigrants from Oceania (84.2%, a difference of 0.010%), White/Caucasian (84.2%, a difference of 0.010%), Panamanian (84.2%, a difference of 0.010%), French American Indian (84.2%, a difference of 0.030%), and Immigrants from Panama (84.2%, a difference of 0.030%).
DemographicsRating | RankIn Labor Force | Age 25-29
Immigrants | West Indies
6.0
/100
|
#224
Tragic
84.2%
Koreans
5.9
/100
|
#225
Tragic
84.2%
Immigrants | Congo
5.8
/100
|
#226
Tragic
84.2%
French American Indians
5.5
/100
|
#227
Tragic
84.2%
Immigrants | Panama
5.5
/100
|
#228
Tragic
84.2%
Immigrants | Oceania
5.0
/100
|
#229
Tragic
84.2%
Whites/Caucasians
4.8
/100
|
#230
Tragic
84.2%
Immigrants | Philippines
4.7
/100
|
#231
Tragic
84.2%
Panamanians
4.5
/100
|
#232
Tragic
84.2%
Immigrants | Western Asia
2.7
/100
|
#233
Tragic
84.1%
Barbadians
1.0
/100
|
#234
Tragic
83.9%
Iraqis
0.9
/100
|
#235
Tragic
83.9%
Guamanians/Chamorros
0.9
/100
|
#236
Tragic
83.9%
Immigrants | Immigrants
0.9
/100
|
#237
Tragic
83.9%
Immigrants | Uzbekistan
0.8
/100
|
#238
Tragic
83.9%

Demographics Similar to Cubans by In Labor Force | Age 25-29

In terms of in labor force | age 25-29, the demographic groups most similar to Cubans are Puget Sound Salish (83.5%, a difference of 0.0%), Aleut (83.4%, a difference of 0.040%), Spanish American (83.4%, a difference of 0.050%), West Indian (83.5%, a difference of 0.060%), and Immigrants from Lebanon (83.4%, a difference of 0.060%).
DemographicsRating | RankIn Labor Force | Age 25-29
Immigrants | Guatemala
0.1
/100
|
#258
Tragic
83.6%
Spanish
0.1
/100
|
#259
Tragic
83.6%
Immigrants | Bahamas
0.1
/100
|
#260
Tragic
83.6%
Pennsylvania Germans
0.1
/100
|
#261
Tragic
83.6%
Immigrants | Fiji
0.1
/100
|
#262
Tragic
83.6%
West Indians
0.1
/100
|
#263
Tragic
83.5%
Puget Sound Salish
0.1
/100
|
#264
Tragic
83.5%
Cubans
0.1
/100
|
#265
Tragic
83.5%
Aleuts
0.0
/100
|
#266
Tragic
83.4%
Spanish Americans
0.0
/100
|
#267
Tragic
83.4%
Immigrants | Lebanon
0.0
/100
|
#268
Tragic
83.4%
Immigrants | Barbados
0.0
/100
|
#269
Tragic
83.4%
Basques
0.0
/100
|
#270
Tragic
83.4%
Hondurans
0.0
/100
|
#271
Tragic
83.4%
Immigrants | Caribbean
0.0
/100
|
#272
Tragic
83.4%