Immigrants from Panama vs Immigrants from Uzbekistan In Labor Force | Age 20-24
COMPARE
Immigrants from Panama
Immigrants from Uzbekistan
In Labor Force | Age 20-24
In Labor Force | Age 20-24 Comparison
Immigrants from Panama
Immigrants from Uzbekistan
73.9%
IN LABOR FORCE | AGE 20-24
1.6/ 100
METRIC RATING
246th/ 347
METRIC RANK
70.4%
IN LABOR FORCE | AGE 20-24
0.0/ 100
METRIC RATING
332nd/ 347
METRIC RANK
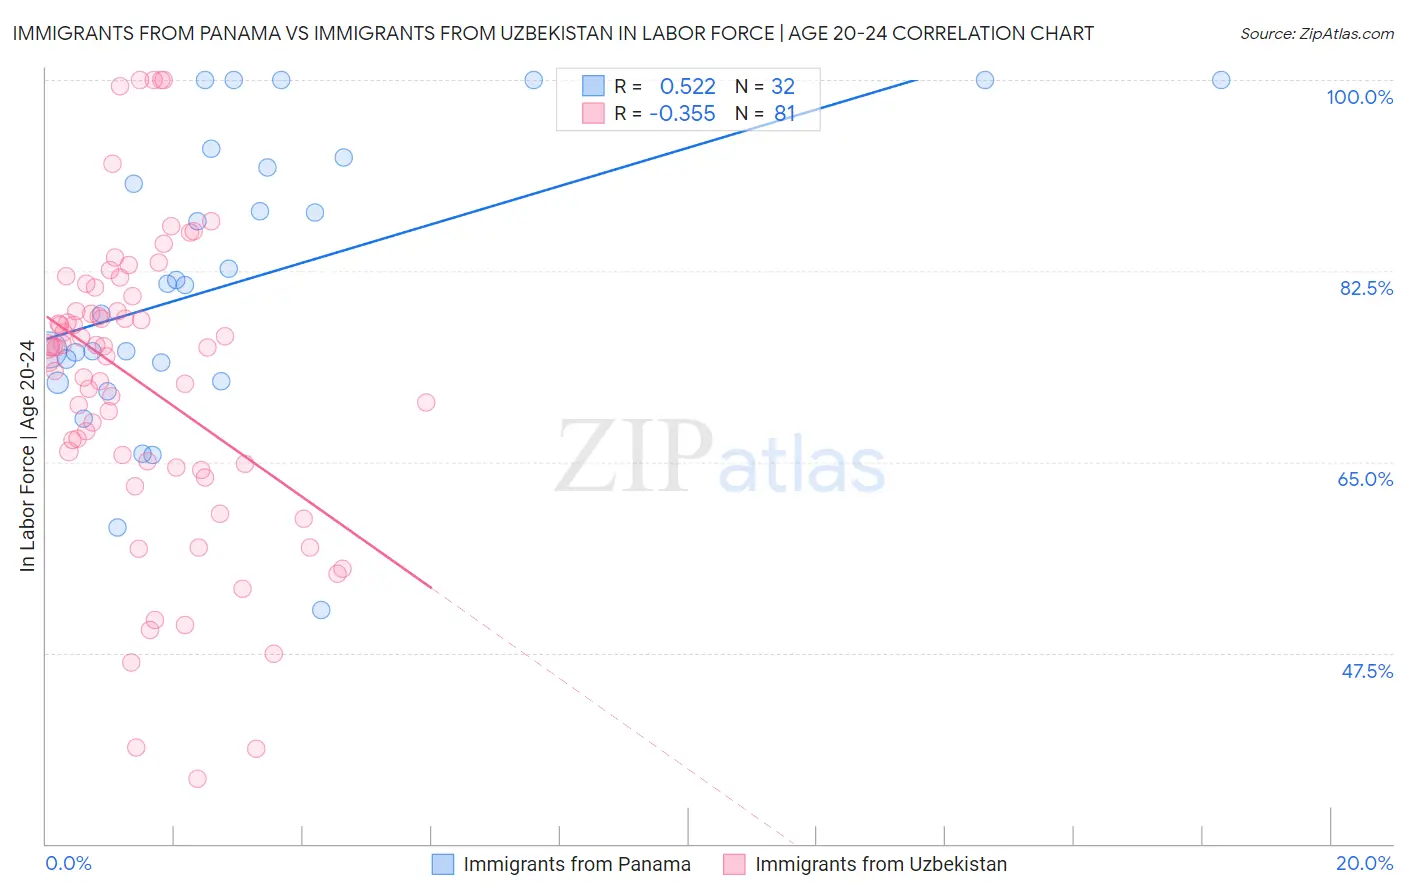
Immigrants from Panama vs Immigrants from Uzbekistan In Labor Force | Age 20-24 Correlation Chart
The statistical analysis conducted on geographies consisting of 221,162,979 people shows a substantial positive correlation between the proportion of Immigrants from Panama and labor force participation rate among population between the ages 20 and 24 in the United States with a correlation coefficient (R) of 0.522 and weighted average of 73.9%. Similarly, the statistical analysis conducted on geographies consisting of 118,725,673 people shows a mild negative correlation between the proportion of Immigrants from Uzbekistan and labor force participation rate among population between the ages 20 and 24 in the United States with a correlation coefficient (R) of -0.355 and weighted average of 70.4%, a difference of 5.0%.
In Labor Force | Age 20-24 Correlation Summary
| Measurement | Immigrants from Panama | Immigrants from Uzbekistan |
| Minimum | 51.4% | 36.0% |
| Maximum | 100.0% | 100.0% |
| Range | 48.6% | 64.0% |
| Mean | 81.7% | 72.2% |
| Median | 81.3% | 75.5% |
| Interquartile 25% (IQ1) | 73.3% | 64.7% |
| Interquartile 75% (IQ3) | 92.4% | 79.5% |
| Interquartile Range (IQR) | 19.2% | 14.9% |
| Standard Deviation (Sample) | 13.0% | 13.9% |
| Standard Deviation (Population) | 12.8% | 13.8% |
Similar Demographics by In Labor Force | Age 20-24
Demographics Similar to Immigrants from Panama by In Labor Force | Age 20-24
In terms of in labor force | age 20-24, the demographic groups most similar to Immigrants from Panama are Colville (73.9%, a difference of 0.030%), Immigrants from Saudi Arabia (73.9%, a difference of 0.030%), Turkish (73.9%, a difference of 0.040%), Immigrants from South Central Asia (74.0%, a difference of 0.060%), and Immigrants from Syria (74.0%, a difference of 0.070%).
| Demographics | Rating | Rank | In Labor Force | Age 20-24 |
| Immigrants | Latin America | 2.7 /100 | #239 | Tragic 74.1% |
| Immigrants | Sri Lanka | 2.3 /100 | #240 | Tragic 74.0% |
| Immigrants | Senegal | 2.1 /100 | #241 | Tragic 74.0% |
| Thais | 2.1 /100 | #242 | Tragic 74.0% |
| Immigrants | Syria | 1.9 /100 | #243 | Tragic 74.0% |
| Immigrants | South Central Asia | 1.9 /100 | #244 | Tragic 74.0% |
| Turks | 1.8 /100 | #245 | Tragic 73.9% |
| Immigrants | Panama | 1.6 /100 | #246 | Tragic 73.9% |
| Colville | 1.5 /100 | #247 | Tragic 73.9% |
| Immigrants | Saudi Arabia | 1.5 /100 | #248 | Tragic 73.9% |
| Blacks/African Americans | 1.3 /100 | #249 | Tragic 73.9% |
| Immigrants | Belgium | 1.3 /100 | #250 | Tragic 73.9% |
| Immigrants | Egypt | 1.2 /100 | #251 | Tragic 73.8% |
| Immigrants | Kazakhstan | 1.1 /100 | #252 | Tragic 73.8% |
| Arapaho | 1.0 /100 | #253 | Tragic 73.8% |
Demographics Similar to Immigrants from Uzbekistan by In Labor Force | Age 20-24
In terms of in labor force | age 20-24, the demographic groups most similar to Immigrants from Uzbekistan are Yuman (70.3%, a difference of 0.23%), Immigrants from Bangladesh (70.6%, a difference of 0.30%), Vietnamese (70.6%, a difference of 0.33%), British West Indian (70.0%, a difference of 0.63%), and Yup'ik (70.9%, a difference of 0.67%).
| Demographics | Rating | Rank | In Labor Force | Age 20-24 |
| Barbadians | 0.0 /100 | #325 | Tragic 71.1% |
| Dominicans | 0.0 /100 | #326 | Tragic 71.1% |
| Immigrants | Trinidad and Tobago | 0.0 /100 | #327 | Tragic 71.1% |
| Immigrants | China | 0.0 /100 | #328 | Tragic 71.1% |
| Yup'ik | 0.0 /100 | #329 | Tragic 70.9% |
| Vietnamese | 0.0 /100 | #330 | Tragic 70.6% |
| Immigrants | Bangladesh | 0.0 /100 | #331 | Tragic 70.6% |
| Immigrants | Uzbekistan | 0.0 /100 | #332 | Tragic 70.4% |
| Yuman | 0.0 /100 | #333 | Tragic 70.3% |
| British West Indians | 0.0 /100 | #334 | Tragic 70.0% |
| Immigrants | Barbados | 0.0 /100 | #335 | Tragic 69.7% |
| Immigrants | Guyana | 0.0 /100 | #336 | Tragic 69.3% |
| Guyanese | 0.0 /100 | #337 | Tragic 69.2% |
| Pima | 0.0 /100 | #338 | Tragic 69.0% |
| Immigrants | Yemen | 0.0 /100 | #339 | Tragic 68.9% |