Immigrants from Somalia vs Immigrants from Uzbekistan In Labor Force | Age 20-24
COMPARE
Immigrants from Somalia
Immigrants from Uzbekistan
In Labor Force | Age 20-24
In Labor Force | Age 20-24 Comparison
Immigrants from Somalia
Immigrants from Uzbekistan
79.5%
IN LABOR FORCE | AGE 20-24
100.0/ 100
METRIC RATING
2nd/ 347
METRIC RANK
70.4%
IN LABOR FORCE | AGE 20-24
0.0/ 100
METRIC RATING
332nd/ 347
METRIC RANK
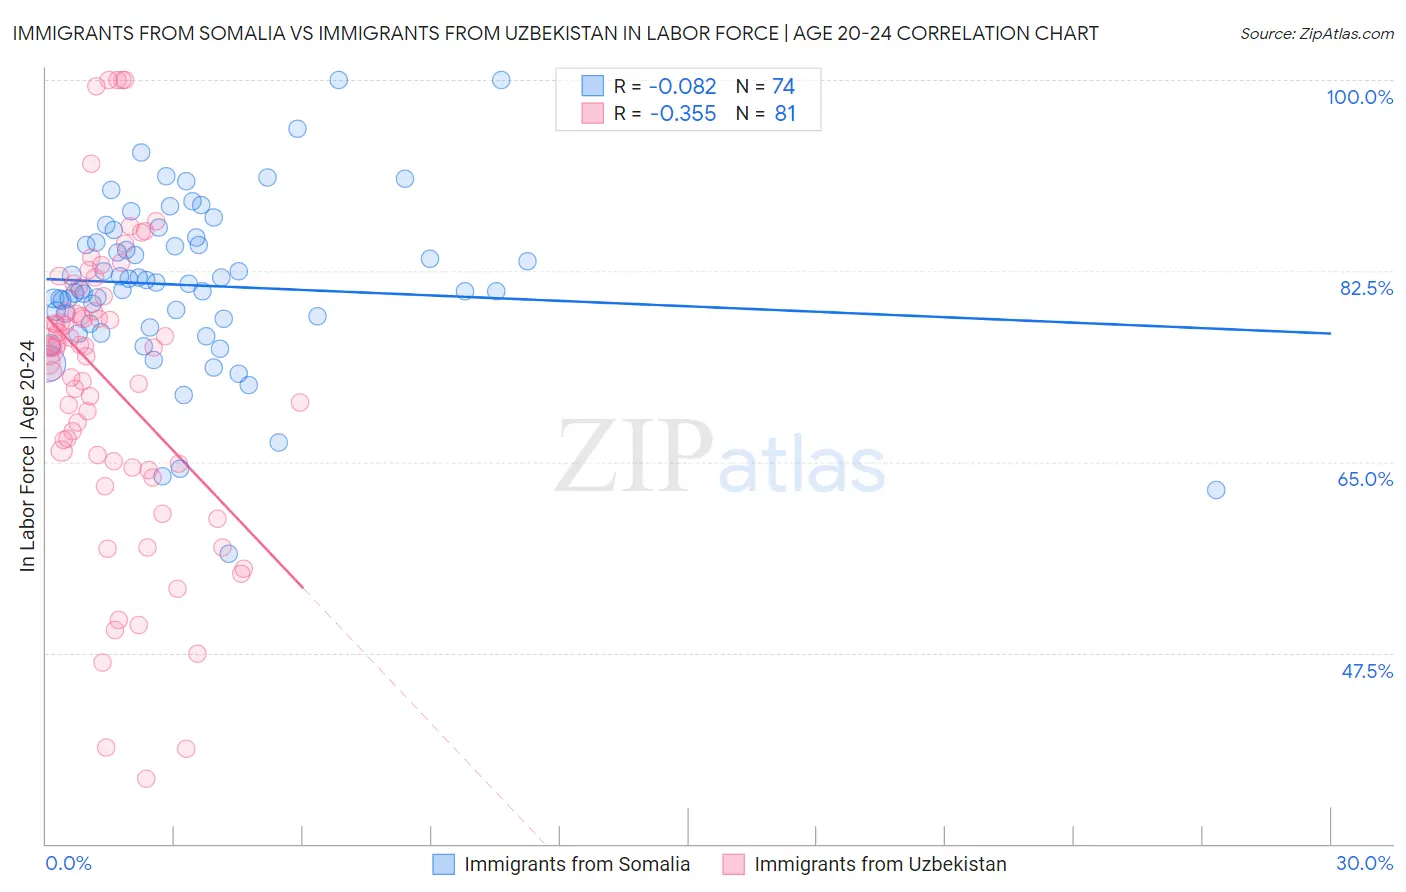
Immigrants from Somalia vs Immigrants from Uzbekistan In Labor Force | Age 20-24 Correlation Chart
The statistical analysis conducted on geographies consisting of 92,105,737 people shows a slight negative correlation between the proportion of Immigrants from Somalia and labor force participation rate among population between the ages 20 and 24 in the United States with a correlation coefficient (R) of -0.082 and weighted average of 79.5%. Similarly, the statistical analysis conducted on geographies consisting of 118,725,673 people shows a mild negative correlation between the proportion of Immigrants from Uzbekistan and labor force participation rate among population between the ages 20 and 24 in the United States with a correlation coefficient (R) of -0.355 and weighted average of 70.4%, a difference of 13.0%.
In Labor Force | Age 20-24 Correlation Summary
| Measurement | Immigrants from Somalia | Immigrants from Uzbekistan |
| Minimum | 56.6% | 36.0% |
| Maximum | 100.0% | 100.0% |
| Range | 43.4% | 64.0% |
| Mean | 81.2% | 72.2% |
| Median | 81.1% | 75.5% |
| Interquartile 25% (IQ1) | 77.7% | 64.7% |
| Interquartile 75% (IQ3) | 85.2% | 79.5% |
| Interquartile Range (IQR) | 7.5% | 14.9% |
| Standard Deviation (Sample) | 7.7% | 13.9% |
| Standard Deviation (Population) | 7.7% | 13.8% |
Similar Demographics by In Labor Force | Age 20-24
Demographics Similar to Immigrants from Somalia by In Labor Force | Age 20-24
In terms of in labor force | age 20-24, the demographic groups most similar to Immigrants from Somalia are Somali (79.3%, a difference of 0.36%), Alaskan Athabascan (79.1%, a difference of 0.55%), Aleut (79.0%, a difference of 0.69%), Danish (79.0%, a difference of 0.70%), and Luxembourger (79.0%, a difference of 0.74%).
| Demographics | Rating | Rank | In Labor Force | Age 20-24 |
| Norwegians | 100.0 /100 | #1 | Exceptional 80.1% |
| Immigrants | Somalia | 100.0 /100 | #2 | Exceptional 79.5% |
| Somalis | 100.0 /100 | #3 | Exceptional 79.3% |
| Alaskan Athabascans | 100.0 /100 | #4 | Exceptional 79.1% |
| Aleuts | 100.0 /100 | #5 | Exceptional 79.0% |
| Danes | 100.0 /100 | #6 | Exceptional 79.0% |
| Luxembourgers | 100.0 /100 | #7 | Exceptional 79.0% |
| Immigrants | Cabo Verde | 100.0 /100 | #8 | Exceptional 78.9% |
| Swedes | 100.0 /100 | #9 | Exceptional 78.8% |
| Slovenes | 100.0 /100 | #10 | Exceptional 78.7% |
| Finns | 100.0 /100 | #11 | Exceptional 78.7% |
| Germans | 100.0 /100 | #12 | Exceptional 78.6% |
| Scandinavians | 100.0 /100 | #13 | Exceptional 78.5% |
| Czechs | 100.0 /100 | #14 | Exceptional 78.5% |
| Sudanese | 100.0 /100 | #15 | Exceptional 78.4% |
Demographics Similar to Immigrants from Uzbekistan by In Labor Force | Age 20-24
In terms of in labor force | age 20-24, the demographic groups most similar to Immigrants from Uzbekistan are Yuman (70.3%, a difference of 0.23%), Immigrants from Bangladesh (70.6%, a difference of 0.30%), Vietnamese (70.6%, a difference of 0.33%), British West Indian (70.0%, a difference of 0.63%), and Yup'ik (70.9%, a difference of 0.67%).
| Demographics | Rating | Rank | In Labor Force | Age 20-24 |
| Barbadians | 0.0 /100 | #325 | Tragic 71.1% |
| Dominicans | 0.0 /100 | #326 | Tragic 71.1% |
| Immigrants | Trinidad and Tobago | 0.0 /100 | #327 | Tragic 71.1% |
| Immigrants | China | 0.0 /100 | #328 | Tragic 71.1% |
| Yup'ik | 0.0 /100 | #329 | Tragic 70.9% |
| Vietnamese | 0.0 /100 | #330 | Tragic 70.6% |
| Immigrants | Bangladesh | 0.0 /100 | #331 | Tragic 70.6% |
| Immigrants | Uzbekistan | 0.0 /100 | #332 | Tragic 70.4% |
| Yuman | 0.0 /100 | #333 | Tragic 70.3% |
| British West Indians | 0.0 /100 | #334 | Tragic 70.0% |
| Immigrants | Barbados | 0.0 /100 | #335 | Tragic 69.7% |
| Immigrants | Guyana | 0.0 /100 | #336 | Tragic 69.3% |
| Guyanese | 0.0 /100 | #337 | Tragic 69.2% |
| Pima | 0.0 /100 | #338 | Tragic 69.0% |
| Immigrants | Yemen | 0.0 /100 | #339 | Tragic 68.9% |