Choctaw vs Immigrants from Uzbekistan In Labor Force | Age 20-24
COMPARE
Choctaw
Immigrants from Uzbekistan
In Labor Force | Age 20-24
In Labor Force | Age 20-24 Comparison
Choctaw
Immigrants from Uzbekistan
74.7%
IN LABOR FORCE | AGE 20-24
21.4/ 100
METRIC RATING
201st/ 347
METRIC RANK
70.4%
IN LABOR FORCE | AGE 20-24
0.0/ 100
METRIC RATING
332nd/ 347
METRIC RANK
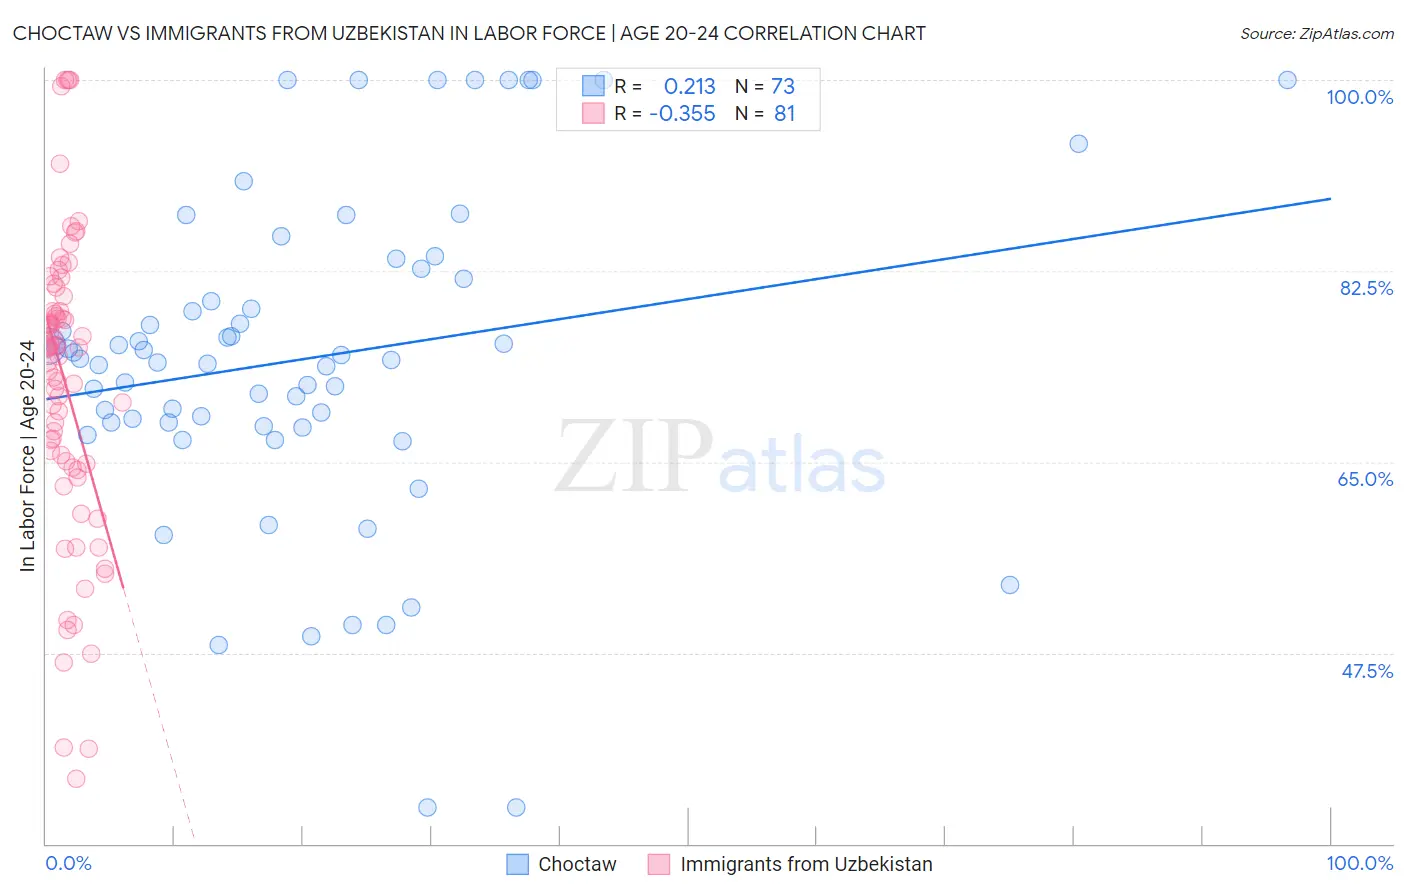
Choctaw vs Immigrants from Uzbekistan In Labor Force | Age 20-24 Correlation Chart
The statistical analysis conducted on geographies consisting of 269,558,461 people shows a weak positive correlation between the proportion of Choctaw and labor force participation rate among population between the ages 20 and 24 in the United States with a correlation coefficient (R) of 0.213 and weighted average of 74.7%. Similarly, the statistical analysis conducted on geographies consisting of 118,725,673 people shows a mild negative correlation between the proportion of Immigrants from Uzbekistan and labor force participation rate among population between the ages 20 and 24 in the United States with a correlation coefficient (R) of -0.355 and weighted average of 70.4%, a difference of 6.1%.
In Labor Force | Age 20-24 Correlation Summary
| Measurement | Choctaw | Immigrants from Uzbekistan |
| Minimum | 33.3% | 36.0% |
| Maximum | 100.0% | 100.0% |
| Range | 66.7% | 64.0% |
| Mean | 74.5% | 72.2% |
| Median | 74.5% | 75.5% |
| Interquartile 25% (IQ1) | 68.4% | 64.7% |
| Interquartile 75% (IQ3) | 82.2% | 79.5% |
| Interquartile Range (IQR) | 13.8% | 14.9% |
| Standard Deviation (Sample) | 14.8% | 13.9% |
| Standard Deviation (Population) | 14.7% | 13.8% |
Similar Demographics by In Labor Force | Age 20-24
Demographics Similar to Choctaw by In Labor Force | Age 20-24
In terms of in labor force | age 20-24, the demographic groups most similar to Choctaw are Nigerian (74.7%, a difference of 0.010%), Moroccan (74.7%, a difference of 0.020%), Taiwanese (74.7%, a difference of 0.040%), Immigrants from Nigeria (74.7%, a difference of 0.060%), and Eastern European (74.8%, a difference of 0.080%).
| Demographics | Rating | Rank | In Labor Force | Age 20-24 |
| Immigrants | Denmark | 25.8 /100 | #194 | Fair 74.8% |
| Eastern Europeans | 25.4 /100 | #195 | Fair 74.8% |
| Immigrants | Vietnam | 25.1 /100 | #196 | Fair 74.7% |
| Panamanians | 25.0 /100 | #197 | Fair 74.7% |
| Immigrants | Nigeria | 24.2 /100 | #198 | Fair 74.7% |
| Taiwanese | 23.2 /100 | #199 | Fair 74.7% |
| Nigerians | 21.9 /100 | #200 | Fair 74.7% |
| Choctaw | 21.4 /100 | #201 | Fair 74.7% |
| Moroccans | 20.4 /100 | #202 | Fair 74.7% |
| Immigrants | Northern Africa | 17.9 /100 | #203 | Poor 74.6% |
| Immigrants | Italy | 17.6 /100 | #204 | Poor 74.6% |
| Inupiat | 17.6 /100 | #205 | Poor 74.6% |
| Sioux | 17.5 /100 | #206 | Poor 74.6% |
| Albanians | 16.2 /100 | #207 | Poor 74.6% |
| Immigrants | Uruguay | 15.8 /100 | #208 | Poor 74.6% |
Demographics Similar to Immigrants from Uzbekistan by In Labor Force | Age 20-24
In terms of in labor force | age 20-24, the demographic groups most similar to Immigrants from Uzbekistan are Yuman (70.3%, a difference of 0.23%), Immigrants from Bangladesh (70.6%, a difference of 0.30%), Vietnamese (70.6%, a difference of 0.33%), British West Indian (70.0%, a difference of 0.63%), and Yup'ik (70.9%, a difference of 0.67%).
| Demographics | Rating | Rank | In Labor Force | Age 20-24 |
| Barbadians | 0.0 /100 | #325 | Tragic 71.1% |
| Dominicans | 0.0 /100 | #326 | Tragic 71.1% |
| Immigrants | Trinidad and Tobago | 0.0 /100 | #327 | Tragic 71.1% |
| Immigrants | China | 0.0 /100 | #328 | Tragic 71.1% |
| Yup'ik | 0.0 /100 | #329 | Tragic 70.9% |
| Vietnamese | 0.0 /100 | #330 | Tragic 70.6% |
| Immigrants | Bangladesh | 0.0 /100 | #331 | Tragic 70.6% |
| Immigrants | Uzbekistan | 0.0 /100 | #332 | Tragic 70.4% |
| Yuman | 0.0 /100 | #333 | Tragic 70.3% |
| British West Indians | 0.0 /100 | #334 | Tragic 70.0% |
| Immigrants | Barbados | 0.0 /100 | #335 | Tragic 69.7% |
| Immigrants | Guyana | 0.0 /100 | #336 | Tragic 69.3% |
| Guyanese | 0.0 /100 | #337 | Tragic 69.2% |
| Pima | 0.0 /100 | #338 | Tragic 69.0% |
| Immigrants | Yemen | 0.0 /100 | #339 | Tragic 68.9% |