Dutch West Indian vs Immigrants from Uzbekistan In Labor Force | Age 20-24
COMPARE
Dutch West Indian
Immigrants from Uzbekistan
In Labor Force | Age 20-24
In Labor Force | Age 20-24 Comparison
Dutch West Indians
Immigrants from Uzbekistan
73.7%
IN LABOR FORCE | AGE 20-24
0.7/ 100
METRIC RATING
259th/ 347
METRIC RANK
70.4%
IN LABOR FORCE | AGE 20-24
0.0/ 100
METRIC RATING
332nd/ 347
METRIC RANK
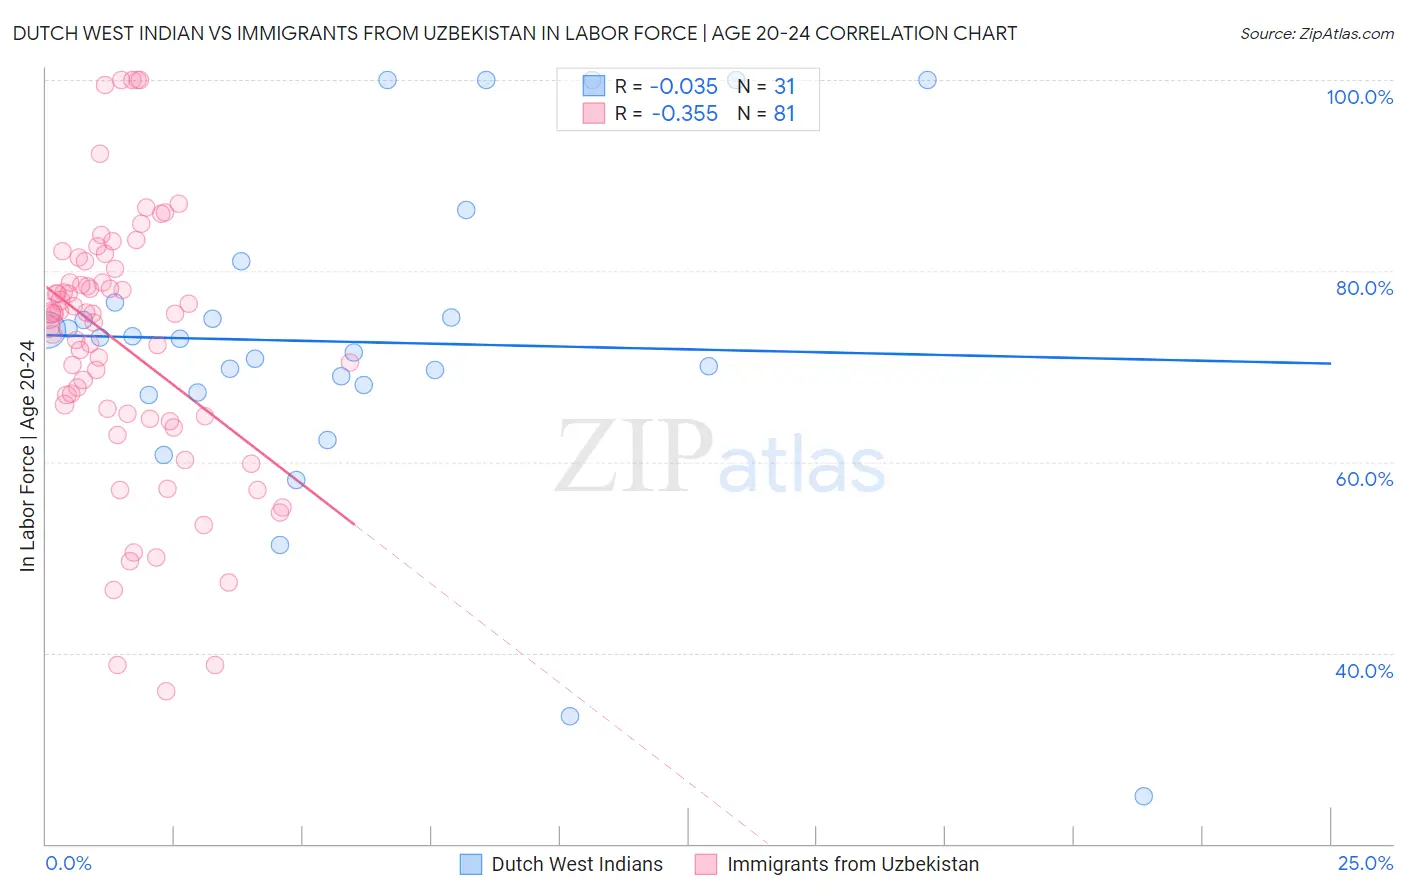
Dutch West Indian vs Immigrants from Uzbekistan In Labor Force | Age 20-24 Correlation Chart
The statistical analysis conducted on geographies consisting of 85,756,423 people shows no correlation between the proportion of Dutch West Indians and labor force participation rate among population between the ages 20 and 24 in the United States with a correlation coefficient (R) of -0.035 and weighted average of 73.7%. Similarly, the statistical analysis conducted on geographies consisting of 118,725,673 people shows a mild negative correlation between the proportion of Immigrants from Uzbekistan and labor force participation rate among population between the ages 20 and 24 in the United States with a correlation coefficient (R) of -0.355 and weighted average of 70.4%, a difference of 4.6%.
In Labor Force | Age 20-24 Correlation Summary
| Measurement | Dutch West Indian | Immigrants from Uzbekistan |
| Minimum | 25.0% | 36.0% |
| Maximum | 100.0% | 100.0% |
| Range | 75.0% | 64.0% |
| Mean | 72.6% | 72.2% |
| Median | 72.9% | 75.5% |
| Interquartile 25% (IQ1) | 67.3% | 64.7% |
| Interquartile 75% (IQ3) | 76.7% | 79.5% |
| Interquartile Range (IQR) | 9.4% | 14.9% |
| Standard Deviation (Sample) | 17.2% | 13.9% |
| Standard Deviation (Population) | 16.9% | 13.8% |
Similar Demographics by In Labor Force | Age 20-24
Demographics Similar to Dutch West Indians by In Labor Force | Age 20-24
In terms of in labor force | age 20-24, the demographic groups most similar to Dutch West Indians are Egyptian (73.7%, a difference of 0.0%), Immigrants from Turkey (73.7%, a difference of 0.030%), Paraguayan (73.7%, a difference of 0.040%), Houma (73.7%, a difference of 0.040%), and Asian (73.7%, a difference of 0.050%).
| Demographics | Rating | Rank | In Labor Force | Age 20-24 |
| Immigrants | Kazakhstan | 1.1 /100 | #252 | Tragic 73.8% |
| Arapaho | 1.0 /100 | #253 | Tragic 73.8% |
| Ute | 1.0 /100 | #254 | Tragic 73.8% |
| Immigrants | Pakistan | 0.9 /100 | #255 | Tragic 73.8% |
| Spanish American Indians | 0.8 /100 | #256 | Tragic 73.7% |
| Paraguayans | 0.8 /100 | #257 | Tragic 73.7% |
| Egyptians | 0.7 /100 | #258 | Tragic 73.7% |
| Dutch West Indians | 0.7 /100 | #259 | Tragic 73.7% |
| Immigrants | Turkey | 0.7 /100 | #260 | Tragic 73.7% |
| Houma | 0.6 /100 | #261 | Tragic 73.7% |
| Asians | 0.6 /100 | #262 | Tragic 73.7% |
| Immigrants | Asia | 0.5 /100 | #263 | Tragic 73.6% |
| Immigrants | Haiti | 0.5 /100 | #264 | Tragic 73.6% |
| Burmese | 0.5 /100 | #265 | Tragic 73.6% |
| Haitians | 0.5 /100 | #266 | Tragic 73.6% |
Demographics Similar to Immigrants from Uzbekistan by In Labor Force | Age 20-24
In terms of in labor force | age 20-24, the demographic groups most similar to Immigrants from Uzbekistan are Yuman (70.3%, a difference of 0.23%), Immigrants from Bangladesh (70.6%, a difference of 0.30%), Vietnamese (70.6%, a difference of 0.33%), British West Indian (70.0%, a difference of 0.63%), and Yup'ik (70.9%, a difference of 0.67%).
| Demographics | Rating | Rank | In Labor Force | Age 20-24 |
| Barbadians | 0.0 /100 | #325 | Tragic 71.1% |
| Dominicans | 0.0 /100 | #326 | Tragic 71.1% |
| Immigrants | Trinidad and Tobago | 0.0 /100 | #327 | Tragic 71.1% |
| Immigrants | China | 0.0 /100 | #328 | Tragic 71.1% |
| Yup'ik | 0.0 /100 | #329 | Tragic 70.9% |
| Vietnamese | 0.0 /100 | #330 | Tragic 70.6% |
| Immigrants | Bangladesh | 0.0 /100 | #331 | Tragic 70.6% |
| Immigrants | Uzbekistan | 0.0 /100 | #332 | Tragic 70.4% |
| Yuman | 0.0 /100 | #333 | Tragic 70.3% |
| British West Indians | 0.0 /100 | #334 | Tragic 70.0% |
| Immigrants | Barbados | 0.0 /100 | #335 | Tragic 69.7% |
| Immigrants | Guyana | 0.0 /100 | #336 | Tragic 69.3% |
| Guyanese | 0.0 /100 | #337 | Tragic 69.2% |
| Pima | 0.0 /100 | #338 | Tragic 69.0% |
| Immigrants | Yemen | 0.0 /100 | #339 | Tragic 68.9% |