Immigrants from Panama vs Immigrants from Cameroon In Labor Force | Age 45-54
COMPARE
Immigrants from Panama
Immigrants from Cameroon
In Labor Force | Age 45-54
In Labor Force | Age 45-54 Comparison
Immigrants from Panama
Immigrants from Cameroon
82.2%
IN LABOR FORCE | AGE 45-54
5.6/ 100
METRIC RATING
214th/ 347
METRIC RANK
84.6%
IN LABOR FORCE | AGE 45-54
100.0/ 100
METRIC RATING
7th/ 347
METRIC RANK
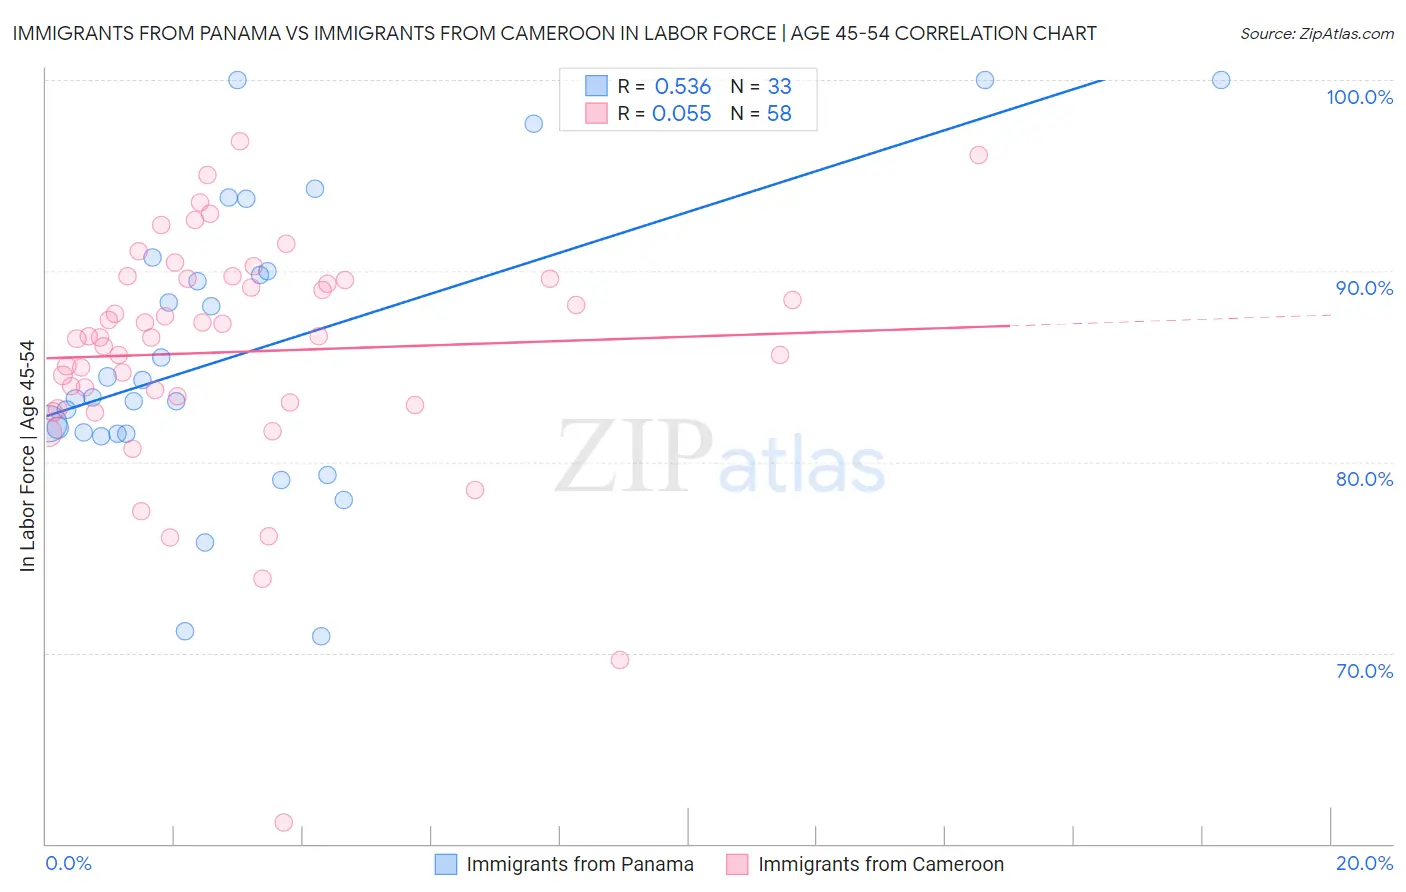
Immigrants from Panama vs Immigrants from Cameroon In Labor Force | Age 45-54 Correlation Chart
The statistical analysis conducted on geographies consisting of 221,155,695 people shows a substantial positive correlation between the proportion of Immigrants from Panama and labor force participation rate among population between the ages 45 and 54 in the United States with a correlation coefficient (R) of 0.536 and weighted average of 82.2%. Similarly, the statistical analysis conducted on geographies consisting of 130,722,370 people shows a slight positive correlation between the proportion of Immigrants from Cameroon and labor force participation rate among population between the ages 45 and 54 in the United States with a correlation coefficient (R) of 0.055 and weighted average of 84.6%, a difference of 2.9%.
In Labor Force | Age 45-54 Correlation Summary
| Measurement | Immigrants from Panama | Immigrants from Cameroon |
| Minimum | 70.9% | 61.1% |
| Maximum | 100.0% | 96.8% |
| Range | 29.1% | 35.7% |
| Mean | 85.8% | 85.8% |
| Median | 83.4% | 86.5% |
| Interquartile 25% (IQ1) | 81.5% | 83.1% |
| Interquartile 75% (IQ3) | 90.3% | 89.6% |
| Interquartile Range (IQR) | 8.9% | 6.5% |
| Standard Deviation (Sample) | 7.6% | 6.2% |
| Standard Deviation (Population) | 7.5% | 6.2% |
Similar Demographics by In Labor Force | Age 45-54
Demographics Similar to Immigrants from Panama by In Labor Force | Age 45-54
In terms of in labor force | age 45-54, the demographic groups most similar to Immigrants from Panama are Iraqi (82.2%, a difference of 0.0%), Immigrants from Uzbekistan (82.3%, a difference of 0.010%), Scottish (82.2%, a difference of 0.010%), Ecuadorian (82.3%, a difference of 0.030%), and Immigrants from Syria (82.3%, a difference of 0.040%).
| Demographics | Rating | Rank | In Labor Force | Age 45-54 |
| Immigrants | Cabo Verde | 8.6 /100 | #207 | Tragic 82.3% |
| Native Hawaiians | 8.5 /100 | #208 | Tragic 82.3% |
| Immigrants | Lebanon | 7.4 /100 | #209 | Tragic 82.3% |
| Immigrants | Bahamas | 7.1 /100 | #210 | Tragic 82.3% |
| Immigrants | Syria | 6.6 /100 | #211 | Tragic 82.3% |
| Ecuadorians | 6.3 /100 | #212 | Tragic 82.3% |
| Immigrants | Uzbekistan | 5.8 /100 | #213 | Tragic 82.3% |
| Immigrants | Panama | 5.6 /100 | #214 | Tragic 82.2% |
| Iraqis | 5.6 /100 | #215 | Tragic 82.2% |
| Scottish | 5.3 /100 | #216 | Tragic 82.2% |
| Portuguese | 4.7 /100 | #217 | Tragic 82.2% |
| English | 4.4 /100 | #218 | Tragic 82.2% |
| French | 4.1 /100 | #219 | Tragic 82.2% |
| Bahamians | 3.6 /100 | #220 | Tragic 82.2% |
| Panamanians | 3.5 /100 | #221 | Tragic 82.2% |
Demographics Similar to Immigrants from Cameroon by In Labor Force | Age 45-54
In terms of in labor force | age 45-54, the demographic groups most similar to Immigrants from Cameroon are Immigrants from India (84.7%, a difference of 0.070%), Sierra Leonean (84.5%, a difference of 0.11%), Ethiopian (84.8%, a difference of 0.18%), Immigrants from Sierra Leone (84.4%, a difference of 0.22%), and Norwegian (84.4%, a difference of 0.24%).
| Demographics | Rating | Rank | In Labor Force | Age 45-54 |
| Immigrants | Bolivia | 100.0 /100 | #1 | Exceptional 85.3% |
| Luxembourgers | 100.0 /100 | #2 | Exceptional 85.0% |
| Bolivians | 100.0 /100 | #3 | Exceptional 84.9% |
| Immigrants | Ethiopia | 100.0 /100 | #4 | Exceptional 84.8% |
| Ethiopians | 100.0 /100 | #5 | Exceptional 84.8% |
| Immigrants | India | 100.0 /100 | #6 | Exceptional 84.7% |
| Immigrants | Cameroon | 100.0 /100 | #7 | Exceptional 84.6% |
| Sierra Leoneans | 100.0 /100 | #8 | Exceptional 84.5% |
| Immigrants | Sierra Leone | 100.0 /100 | #9 | Exceptional 84.4% |
| Norwegians | 100.0 /100 | #10 | Exceptional 84.4% |
| Thais | 100.0 /100 | #11 | Exceptional 84.3% |
| Bulgarians | 100.0 /100 | #12 | Exceptional 84.2% |
| Chinese | 99.9 /100 | #13 | Exceptional 84.1% |
| Cambodians | 99.9 /100 | #14 | Exceptional 84.1% |
| Cypriots | 99.9 /100 | #15 | Exceptional 84.1% |