Czechoslovakian vs Immigrants from Cameroon In Labor Force | Age 45-54
COMPARE
Czechoslovakian
Immigrants from Cameroon
In Labor Force | Age 45-54
In Labor Force | Age 45-54 Comparison
Czechoslovakians
Immigrants from Cameroon
83.0%
IN LABOR FORCE | AGE 45-54
74.8/ 100
METRIC RATING
147th/ 347
METRIC RANK
84.6%
IN LABOR FORCE | AGE 45-54
100.0/ 100
METRIC RATING
7th/ 347
METRIC RANK
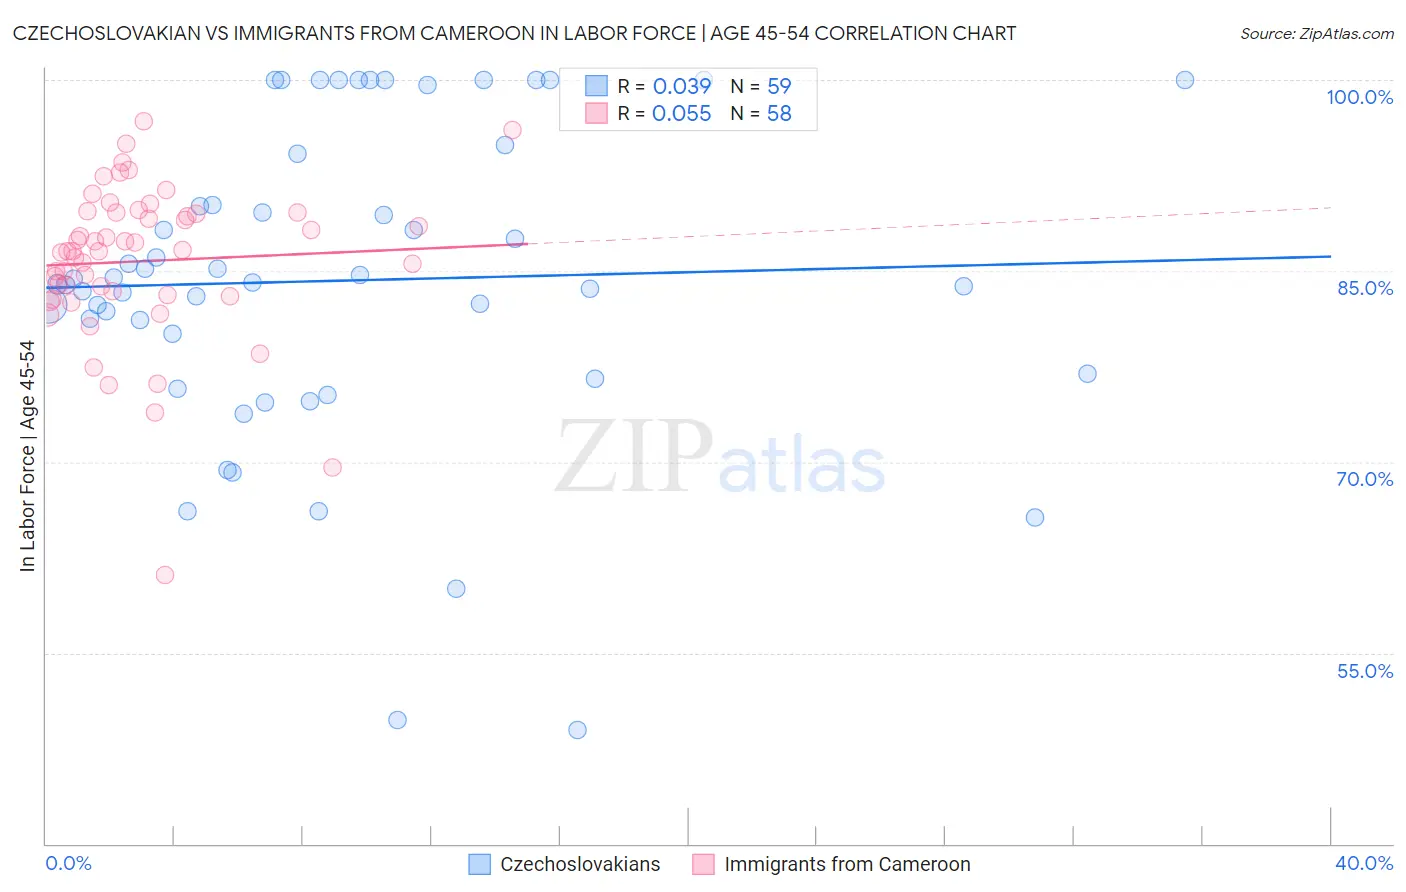
Czechoslovakian vs Immigrants from Cameroon In Labor Force | Age 45-54 Correlation Chart
The statistical analysis conducted on geographies consisting of 368,521,801 people shows no correlation between the proportion of Czechoslovakians and labor force participation rate among population between the ages 45 and 54 in the United States with a correlation coefficient (R) of 0.039 and weighted average of 83.0%. Similarly, the statistical analysis conducted on geographies consisting of 130,722,370 people shows a slight positive correlation between the proportion of Immigrants from Cameroon and labor force participation rate among population between the ages 45 and 54 in the United States with a correlation coefficient (R) of 0.055 and weighted average of 84.6%, a difference of 2.0%.
In Labor Force | Age 45-54 Correlation Summary
| Measurement | Czechoslovakian | Immigrants from Cameroon |
| Minimum | 48.9% | 61.1% |
| Maximum | 100.0% | 96.8% |
| Range | 51.1% | 35.7% |
| Mean | 84.2% | 85.8% |
| Median | 84.1% | 86.5% |
| Interquartile 25% (IQ1) | 76.9% | 83.1% |
| Interquartile 75% (IQ3) | 94.2% | 89.6% |
| Interquartile Range (IQR) | 17.3% | 6.5% |
| Standard Deviation (Sample) | 12.2% | 6.2% |
| Standard Deviation (Population) | 12.1% | 6.2% |
Similar Demographics by In Labor Force | Age 45-54
Demographics Similar to Czechoslovakians by In Labor Force | Age 45-54
In terms of in labor force | age 45-54, the demographic groups most similar to Czechoslovakians are Romanian (83.0%, a difference of 0.010%), Immigrants from France (83.0%, a difference of 0.010%), Immigrants from Nigeria (83.0%, a difference of 0.010%), Soviet Union (83.0%, a difference of 0.020%), and Immigrants from Sweden (82.9%, a difference of 0.020%).
| Demographics | Rating | Rank | In Labor Force | Age 45-54 |
| Yugoslavians | 78.3 /100 | #140 | Good 83.0% |
| Immigrants | Haiti | 77.9 /100 | #141 | Good 83.0% |
| Immigrants | Scotland | 77.8 /100 | #142 | Good 83.0% |
| Okinawans | 77.0 /100 | #143 | Good 83.0% |
| Soviet Union | 76.8 /100 | #144 | Good 83.0% |
| Romanians | 75.4 /100 | #145 | Good 83.0% |
| Immigrants | France | 75.3 /100 | #146 | Good 83.0% |
| Czechoslovakians | 74.8 /100 | #147 | Good 83.0% |
| Immigrants | Nigeria | 74.1 /100 | #148 | Good 83.0% |
| Immigrants | Sweden | 73.3 /100 | #149 | Good 82.9% |
| Immigrants | Netherlands | 72.6 /100 | #150 | Good 82.9% |
| Koreans | 71.9 /100 | #151 | Good 82.9% |
| Slavs | 71.5 /100 | #152 | Good 82.9% |
| Immigrants | Indonesia | 70.6 /100 | #153 | Good 82.9% |
| Immigrants | Ghana | 70.3 /100 | #154 | Good 82.9% |
Demographics Similar to Immigrants from Cameroon by In Labor Force | Age 45-54
In terms of in labor force | age 45-54, the demographic groups most similar to Immigrants from Cameroon are Immigrants from India (84.7%, a difference of 0.070%), Sierra Leonean (84.5%, a difference of 0.11%), Ethiopian (84.8%, a difference of 0.18%), Immigrants from Sierra Leone (84.4%, a difference of 0.22%), and Norwegian (84.4%, a difference of 0.24%).
| Demographics | Rating | Rank | In Labor Force | Age 45-54 |
| Immigrants | Bolivia | 100.0 /100 | #1 | Exceptional 85.3% |
| Luxembourgers | 100.0 /100 | #2 | Exceptional 85.0% |
| Bolivians | 100.0 /100 | #3 | Exceptional 84.9% |
| Immigrants | Ethiopia | 100.0 /100 | #4 | Exceptional 84.8% |
| Ethiopians | 100.0 /100 | #5 | Exceptional 84.8% |
| Immigrants | India | 100.0 /100 | #6 | Exceptional 84.7% |
| Immigrants | Cameroon | 100.0 /100 | #7 | Exceptional 84.6% |
| Sierra Leoneans | 100.0 /100 | #8 | Exceptional 84.5% |
| Immigrants | Sierra Leone | 100.0 /100 | #9 | Exceptional 84.4% |
| Norwegians | 100.0 /100 | #10 | Exceptional 84.4% |
| Thais | 100.0 /100 | #11 | Exceptional 84.3% |
| Bulgarians | 100.0 /100 | #12 | Exceptional 84.2% |
| Chinese | 99.9 /100 | #13 | Exceptional 84.1% |
| Cambodians | 99.9 /100 | #14 | Exceptional 84.1% |
| Cypriots | 99.9 /100 | #15 | Exceptional 84.1% |