Immigrants from Panama vs Bermudan In Labor Force | Age 45-54
COMPARE
Immigrants from Panama
Bermudan
In Labor Force | Age 45-54
In Labor Force | Age 45-54 Comparison
Immigrants from Panama
Bermudans
82.2%
IN LABOR FORCE | AGE 45-54
5.6/ 100
METRIC RATING
214th/ 347
METRIC RANK
83.1%
IN LABOR FORCE | AGE 45-54
88.0/ 100
METRIC RATING
124th/ 347
METRIC RANK
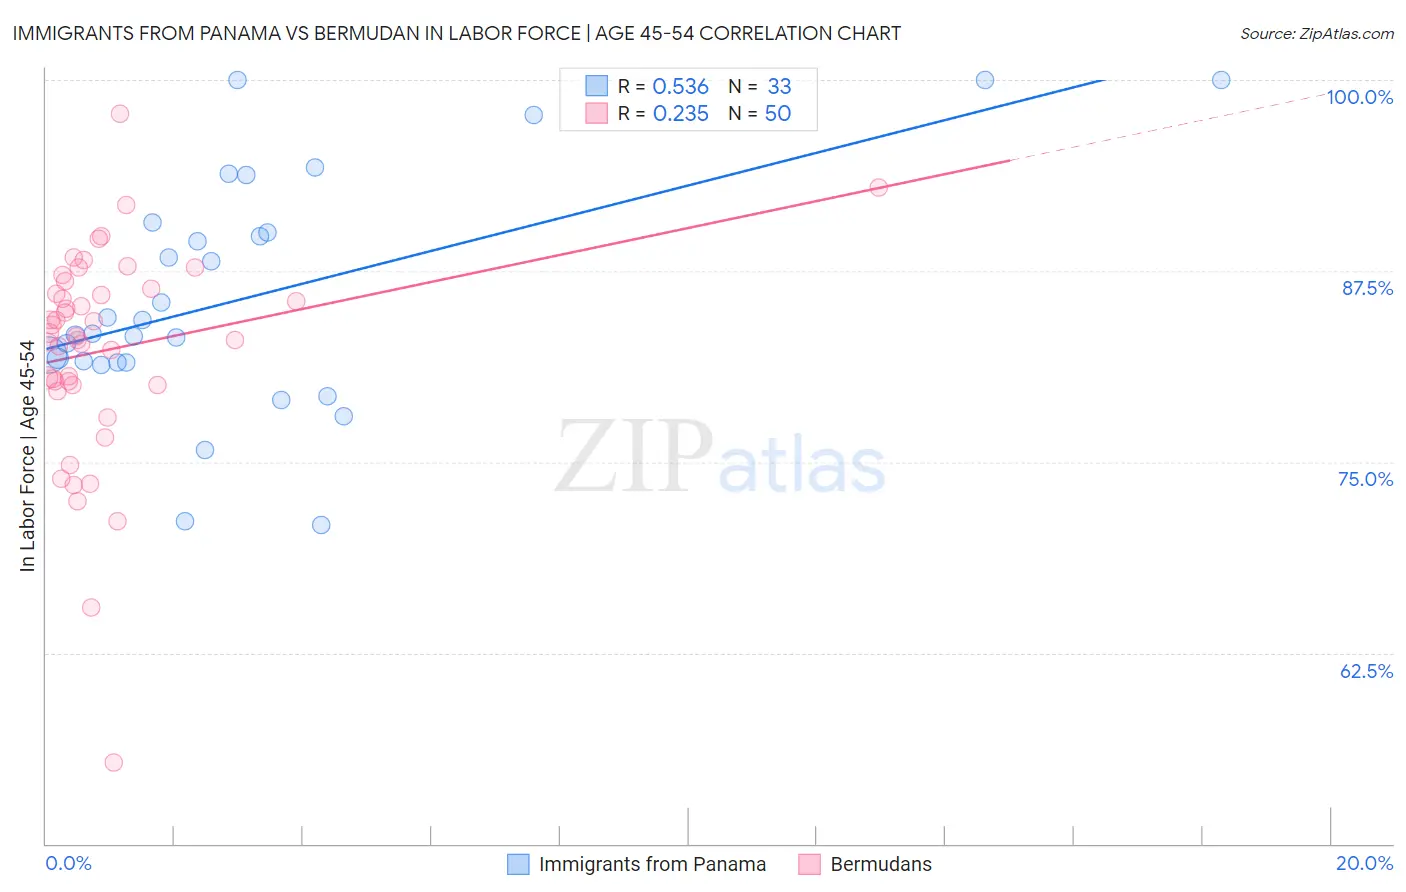
Immigrants from Panama vs Bermudan In Labor Force | Age 45-54 Correlation Chart
The statistical analysis conducted on geographies consisting of 221,155,695 people shows a substantial positive correlation between the proportion of Immigrants from Panama and labor force participation rate among population between the ages 45 and 54 in the United States with a correlation coefficient (R) of 0.536 and weighted average of 82.2%. Similarly, the statistical analysis conducted on geographies consisting of 55,715,223 people shows a weak positive correlation between the proportion of Bermudans and labor force participation rate among population between the ages 45 and 54 in the United States with a correlation coefficient (R) of 0.235 and weighted average of 83.1%, a difference of 1.1%.
In Labor Force | Age 45-54 Correlation Summary
| Measurement | Immigrants from Panama | Bermudan |
| Minimum | 70.9% | 55.3% |
| Maximum | 100.0% | 97.8% |
| Range | 29.1% | 42.5% |
| Mean | 85.8% | 82.3% |
| Median | 83.4% | 83.3% |
| Interquartile 25% (IQ1) | 81.5% | 80.0% |
| Interquartile 75% (IQ3) | 90.3% | 86.3% |
| Interquartile Range (IQR) | 8.9% | 6.3% |
| Standard Deviation (Sample) | 7.6% | 7.1% |
| Standard Deviation (Population) | 7.5% | 7.0% |
Similar Demographics by In Labor Force | Age 45-54
Demographics Similar to Immigrants from Panama by In Labor Force | Age 45-54
In terms of in labor force | age 45-54, the demographic groups most similar to Immigrants from Panama are Iraqi (82.2%, a difference of 0.0%), Immigrants from Uzbekistan (82.3%, a difference of 0.010%), Scottish (82.2%, a difference of 0.010%), Ecuadorian (82.3%, a difference of 0.030%), and Immigrants from Syria (82.3%, a difference of 0.040%).
| Demographics | Rating | Rank | In Labor Force | Age 45-54 |
| Immigrants | Cabo Verde | 8.6 /100 | #207 | Tragic 82.3% |
| Native Hawaiians | 8.5 /100 | #208 | Tragic 82.3% |
| Immigrants | Lebanon | 7.4 /100 | #209 | Tragic 82.3% |
| Immigrants | Bahamas | 7.1 /100 | #210 | Tragic 82.3% |
| Immigrants | Syria | 6.6 /100 | #211 | Tragic 82.3% |
| Ecuadorians | 6.3 /100 | #212 | Tragic 82.3% |
| Immigrants | Uzbekistan | 5.8 /100 | #213 | Tragic 82.3% |
| Immigrants | Panama | 5.6 /100 | #214 | Tragic 82.2% |
| Iraqis | 5.6 /100 | #215 | Tragic 82.2% |
| Scottish | 5.3 /100 | #216 | Tragic 82.2% |
| Portuguese | 4.7 /100 | #217 | Tragic 82.2% |
| English | 4.4 /100 | #218 | Tragic 82.2% |
| French | 4.1 /100 | #219 | Tragic 82.2% |
| Bahamians | 3.6 /100 | #220 | Tragic 82.2% |
| Panamanians | 3.5 /100 | #221 | Tragic 82.2% |
Demographics Similar to Bermudans by In Labor Force | Age 45-54
In terms of in labor force | age 45-54, the demographic groups most similar to Bermudans are Tongan (83.1%, a difference of 0.0%), Immigrants from Vietnam (83.1%, a difference of 0.020%), Immigrants from Iran (83.1%, a difference of 0.020%), Uruguayan (83.1%, a difference of 0.030%), and Immigrants from Belgium (83.1%, a difference of 0.030%).
| Demographics | Rating | Rank | In Labor Force | Age 45-54 |
| Immigrants | China | 90.9 /100 | #117 | Exceptional 83.2% |
| Immigrants | Europe | 90.7 /100 | #118 | Exceptional 83.2% |
| Immigrants | Uruguay | 90.2 /100 | #119 | Exceptional 83.2% |
| Immigrants | Russia | 90.1 /100 | #120 | Exceptional 83.2% |
| Uruguayans | 89.4 /100 | #121 | Excellent 83.1% |
| Immigrants | Vietnam | 88.9 /100 | #122 | Excellent 83.1% |
| Tongans | 88.2 /100 | #123 | Excellent 83.1% |
| Bermudans | 88.0 /100 | #124 | Excellent 83.1% |
| Immigrants | Iran | 87.2 /100 | #125 | Excellent 83.1% |
| Immigrants | Belgium | 86.4 /100 | #126 | Excellent 83.1% |
| Immigrants | Jordan | 85.2 /100 | #127 | Excellent 83.1% |
| Germans | 85.1 /100 | #128 | Excellent 83.1% |
| Immigrants | Northern Europe | 85.1 /100 | #129 | Excellent 83.1% |
| Immigrants | Israel | 84.7 /100 | #130 | Excellent 83.1% |
| Finns | 83.3 /100 | #131 | Excellent 83.1% |