Immigrants from Panama vs Polish In Labor Force | Age 45-54
COMPARE
Immigrants from Panama
Polish
In Labor Force | Age 45-54
In Labor Force | Age 45-54 Comparison
Immigrants from Panama
Poles
82.2%
IN LABOR FORCE | AGE 45-54
5.6/ 100
METRIC RATING
214th/ 347
METRIC RANK
83.6%
IN LABOR FORCE | AGE 45-54
98.7/ 100
METRIC RATING
52nd/ 347
METRIC RANK
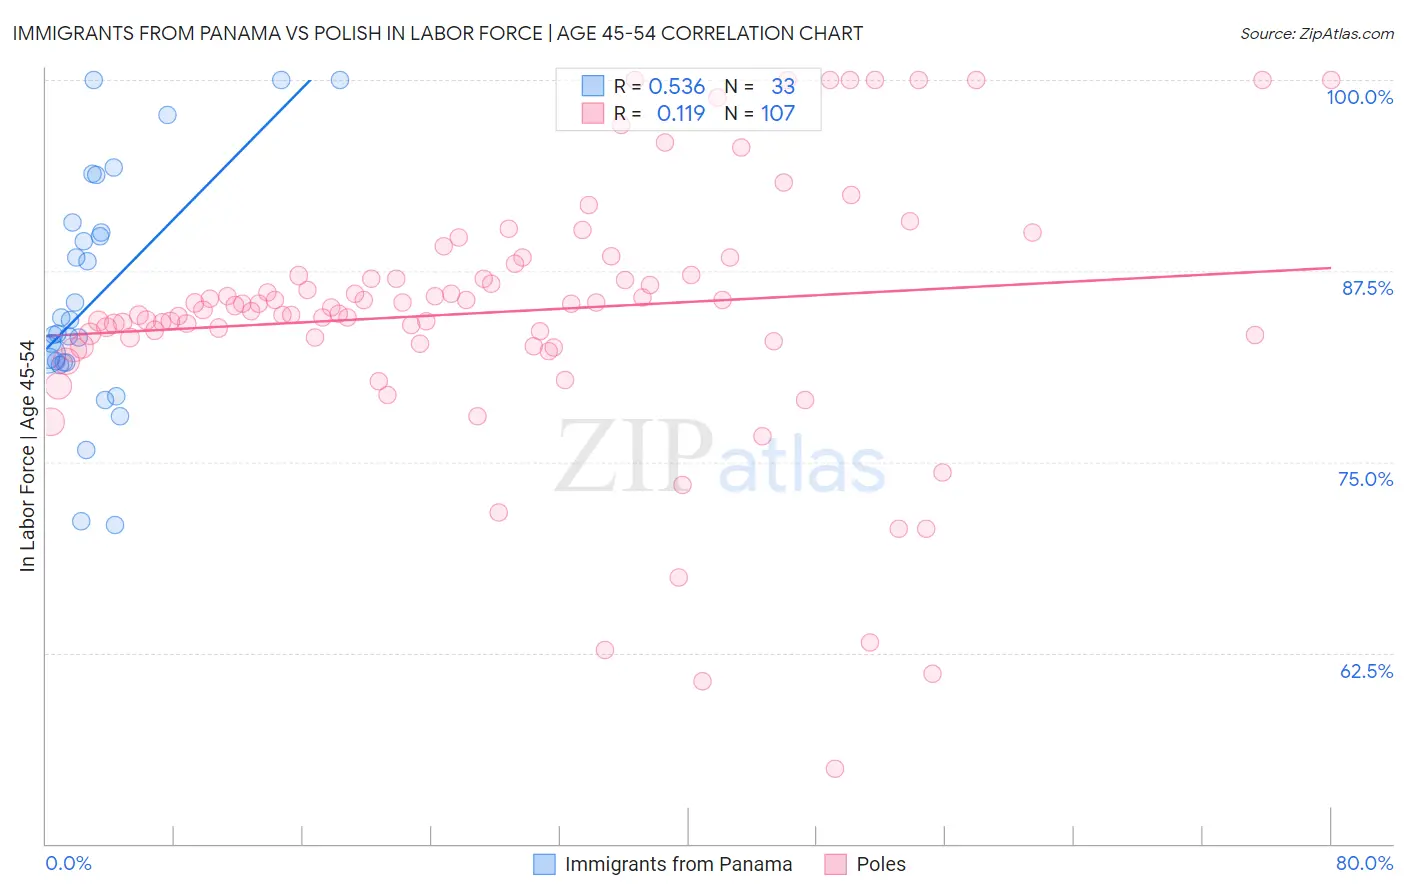
Immigrants from Panama vs Polish In Labor Force | Age 45-54 Correlation Chart
The statistical analysis conducted on geographies consisting of 221,155,695 people shows a substantial positive correlation between the proportion of Immigrants from Panama and labor force participation rate among population between the ages 45 and 54 in the United States with a correlation coefficient (R) of 0.536 and weighted average of 82.2%. Similarly, the statistical analysis conducted on geographies consisting of 559,827,067 people shows a poor positive correlation between the proportion of Poles and labor force participation rate among population between the ages 45 and 54 in the United States with a correlation coefficient (R) of 0.119 and weighted average of 83.6%, a difference of 1.6%.
In Labor Force | Age 45-54 Correlation Summary
| Measurement | Immigrants from Panama | Polish |
| Minimum | 70.9% | 54.9% |
| Maximum | 100.0% | 100.0% |
| Range | 29.1% | 45.1% |
| Mean | 85.8% | 84.8% |
| Median | 83.4% | 85.1% |
| Interquartile 25% (IQ1) | 81.5% | 82.9% |
| Interquartile 75% (IQ3) | 90.3% | 87.2% |
| Interquartile Range (IQR) | 8.9% | 4.3% |
| Standard Deviation (Sample) | 7.6% | 8.5% |
| Standard Deviation (Population) | 7.5% | 8.4% |
Similar Demographics by In Labor Force | Age 45-54
Demographics Similar to Immigrants from Panama by In Labor Force | Age 45-54
In terms of in labor force | age 45-54, the demographic groups most similar to Immigrants from Panama are Iraqi (82.2%, a difference of 0.0%), Immigrants from Uzbekistan (82.3%, a difference of 0.010%), Scottish (82.2%, a difference of 0.010%), Ecuadorian (82.3%, a difference of 0.030%), and Immigrants from Syria (82.3%, a difference of 0.040%).
| Demographics | Rating | Rank | In Labor Force | Age 45-54 |
| Immigrants | Cabo Verde | 8.6 /100 | #207 | Tragic 82.3% |
| Native Hawaiians | 8.5 /100 | #208 | Tragic 82.3% |
| Immigrants | Lebanon | 7.4 /100 | #209 | Tragic 82.3% |
| Immigrants | Bahamas | 7.1 /100 | #210 | Tragic 82.3% |
| Immigrants | Syria | 6.6 /100 | #211 | Tragic 82.3% |
| Ecuadorians | 6.3 /100 | #212 | Tragic 82.3% |
| Immigrants | Uzbekistan | 5.8 /100 | #213 | Tragic 82.3% |
| Immigrants | Panama | 5.6 /100 | #214 | Tragic 82.2% |
| Iraqis | 5.6 /100 | #215 | Tragic 82.2% |
| Scottish | 5.3 /100 | #216 | Tragic 82.2% |
| Portuguese | 4.7 /100 | #217 | Tragic 82.2% |
| English | 4.4 /100 | #218 | Tragic 82.2% |
| French | 4.1 /100 | #219 | Tragic 82.2% |
| Bahamians | 3.6 /100 | #220 | Tragic 82.2% |
| Panamanians | 3.5 /100 | #221 | Tragic 82.2% |
Demographics Similar to Poles by In Labor Force | Age 45-54
In terms of in labor force | age 45-54, the demographic groups most similar to Poles are Immigrants from Turkey (83.6%, a difference of 0.0%), Peruvian (83.6%, a difference of 0.0%), Immigrants from Greece (83.6%, a difference of 0.010%), Somali (83.5%, a difference of 0.010%), and Macedonian (83.5%, a difference of 0.020%).
| Demographics | Rating | Rank | In Labor Force | Age 45-54 |
| Immigrants | Hong Kong | 99.1 /100 | #45 | Exceptional 83.6% |
| Lithuanians | 99.1 /100 | #46 | Exceptional 83.6% |
| Croatians | 99.0 /100 | #47 | Exceptional 83.6% |
| Immigrants | Poland | 99.0 /100 | #48 | Exceptional 83.6% |
| Immigrants | Morocco | 99.0 /100 | #49 | Exceptional 83.6% |
| Immigrants | Greece | 98.8 /100 | #50 | Exceptional 83.6% |
| Immigrants | Turkey | 98.8 /100 | #51 | Exceptional 83.6% |
| Poles | 98.7 /100 | #52 | Exceptional 83.6% |
| Peruvians | 98.7 /100 | #53 | Exceptional 83.6% |
| Somalis | 98.7 /100 | #54 | Exceptional 83.5% |
| Macedonians | 98.7 /100 | #55 | Exceptional 83.5% |
| Immigrants | Peru | 98.6 /100 | #56 | Exceptional 83.5% |
| Paraguayans | 98.5 /100 | #57 | Exceptional 83.5% |
| Eastern Europeans | 98.5 /100 | #58 | Exceptional 83.5% |
| Bhutanese | 98.3 /100 | #59 | Exceptional 83.5% |