Albanian vs Immigrants from Cameroon In Labor Force | Age 45-54
COMPARE
Albanian
Immigrants from Cameroon
In Labor Force | Age 45-54
In Labor Force | Age 45-54 Comparison
Albanians
Immigrants from Cameroon
83.3%
IN LABOR FORCE | AGE 45-54
93.9/ 100
METRIC RATING
103rd/ 347
METRIC RANK
84.6%
IN LABOR FORCE | AGE 45-54
100.0/ 100
METRIC RATING
7th/ 347
METRIC RANK
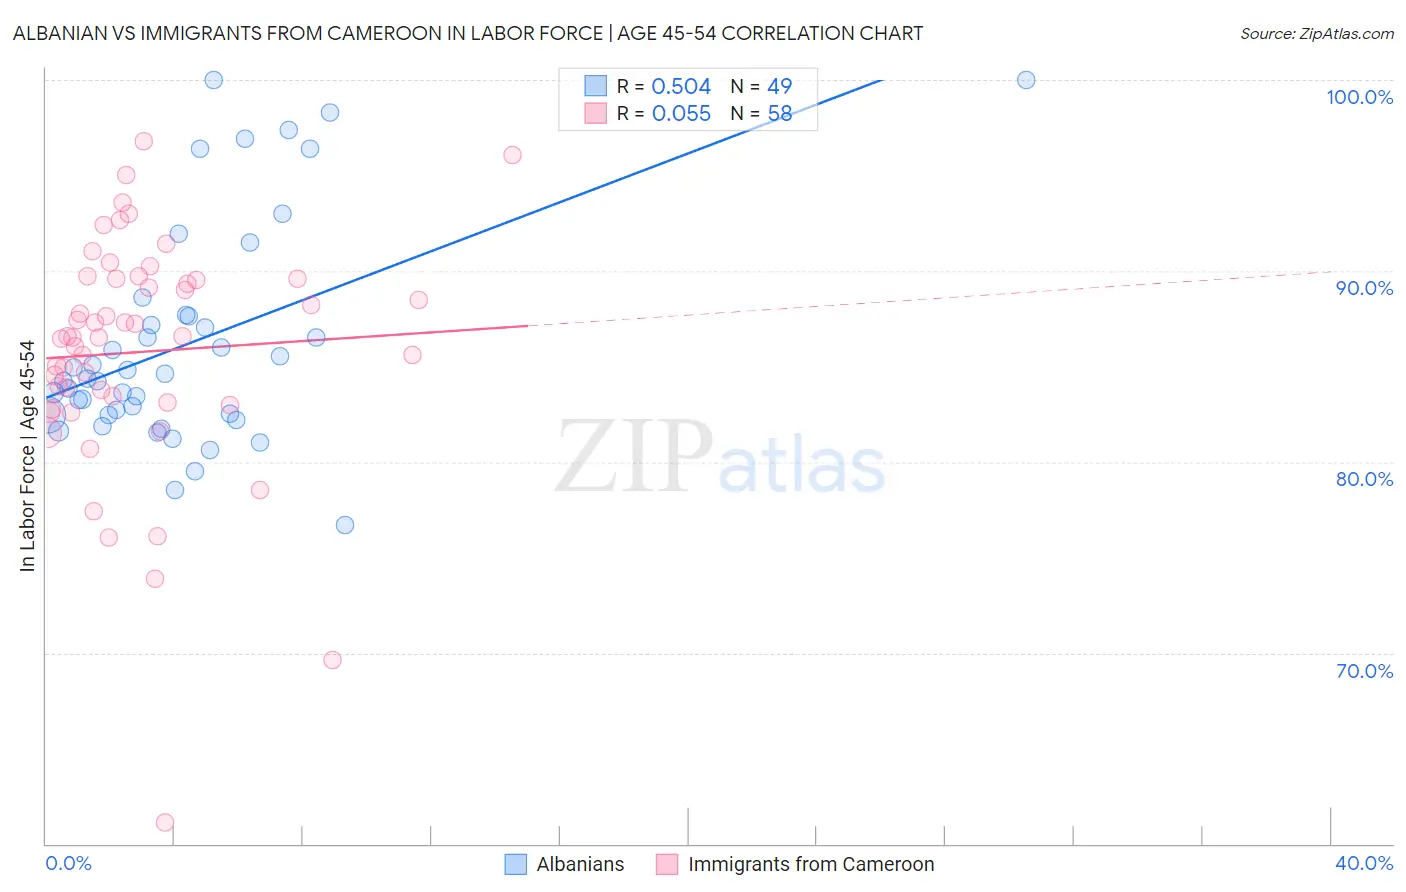
Albanian vs Immigrants from Cameroon In Labor Force | Age 45-54 Correlation Chart
The statistical analysis conducted on geographies consisting of 193,191,598 people shows a substantial positive correlation between the proportion of Albanians and labor force participation rate among population between the ages 45 and 54 in the United States with a correlation coefficient (R) of 0.504 and weighted average of 83.3%. Similarly, the statistical analysis conducted on geographies consisting of 130,722,370 people shows a slight positive correlation between the proportion of Immigrants from Cameroon and labor force participation rate among population between the ages 45 and 54 in the United States with a correlation coefficient (R) of 0.055 and weighted average of 84.6%, a difference of 1.6%.
In Labor Force | Age 45-54 Correlation Summary
| Measurement | Albanian | Immigrants from Cameroon |
| Minimum | 76.7% | 61.1% |
| Maximum | 100.0% | 96.8% |
| Range | 23.3% | 35.7% |
| Mean | 86.2% | 85.8% |
| Median | 84.3% | 86.5% |
| Interquartile 25% (IQ1) | 82.5% | 83.1% |
| Interquartile 75% (IQ3) | 87.7% | 89.6% |
| Interquartile Range (IQR) | 5.2% | 6.5% |
| Standard Deviation (Sample) | 5.8% | 6.2% |
| Standard Deviation (Population) | 5.7% | 6.2% |
Similar Demographics by In Labor Force | Age 45-54
Demographics Similar to Albanians by In Labor Force | Age 45-54
In terms of in labor force | age 45-54, the demographic groups most similar to Albanians are Immigrants from Singapore (83.3%, a difference of 0.0%), Immigrants from Romania (83.3%, a difference of 0.0%), Immigrants from Middle Africa (83.3%, a difference of 0.010%), Mongolian (83.3%, a difference of 0.010%), and Immigrants from Belarus (83.3%, a difference of 0.010%).
| Demographics | Rating | Rank | In Labor Force | Age 45-54 |
| Immigrants | Kuwait | 94.8 /100 | #96 | Exceptional 83.3% |
| Palestinians | 94.8 /100 | #97 | Exceptional 83.3% |
| Maltese | 94.4 /100 | #98 | Exceptional 83.3% |
| Immigrants | Middle Africa | 94.3 /100 | #99 | Exceptional 83.3% |
| Mongolians | 94.2 /100 | #100 | Exceptional 83.3% |
| Immigrants | Belarus | 94.1 /100 | #101 | Exceptional 83.3% |
| Immigrants | Singapore | 93.9 /100 | #102 | Exceptional 83.3% |
| Albanians | 93.9 /100 | #103 | Exceptional 83.3% |
| Immigrants | Romania | 93.8 /100 | #104 | Exceptional 83.3% |
| Immigrants | South America | 93.5 /100 | #105 | Exceptional 83.2% |
| Sri Lankans | 93.2 /100 | #106 | Exceptional 83.2% |
| Iranians | 92.9 /100 | #107 | Exceptional 83.2% |
| Slovaks | 92.8 /100 | #108 | Exceptional 83.2% |
| Ukrainians | 92.7 /100 | #109 | Exceptional 83.2% |
| Immigrants | Africa | 92.6 /100 | #110 | Exceptional 83.2% |
Demographics Similar to Immigrants from Cameroon by In Labor Force | Age 45-54
In terms of in labor force | age 45-54, the demographic groups most similar to Immigrants from Cameroon are Immigrants from India (84.7%, a difference of 0.070%), Sierra Leonean (84.5%, a difference of 0.11%), Ethiopian (84.8%, a difference of 0.18%), Immigrants from Sierra Leone (84.4%, a difference of 0.22%), and Norwegian (84.4%, a difference of 0.24%).
| Demographics | Rating | Rank | In Labor Force | Age 45-54 |
| Immigrants | Bolivia | 100.0 /100 | #1 | Exceptional 85.3% |
| Luxembourgers | 100.0 /100 | #2 | Exceptional 85.0% |
| Bolivians | 100.0 /100 | #3 | Exceptional 84.9% |
| Immigrants | Ethiopia | 100.0 /100 | #4 | Exceptional 84.8% |
| Ethiopians | 100.0 /100 | #5 | Exceptional 84.8% |
| Immigrants | India | 100.0 /100 | #6 | Exceptional 84.7% |
| Immigrants | Cameroon | 100.0 /100 | #7 | Exceptional 84.6% |
| Sierra Leoneans | 100.0 /100 | #8 | Exceptional 84.5% |
| Immigrants | Sierra Leone | 100.0 /100 | #9 | Exceptional 84.4% |
| Norwegians | 100.0 /100 | #10 | Exceptional 84.4% |
| Thais | 100.0 /100 | #11 | Exceptional 84.3% |
| Bulgarians | 100.0 /100 | #12 | Exceptional 84.2% |
| Chinese | 99.9 /100 | #13 | Exceptional 84.1% |
| Cambodians | 99.9 /100 | #14 | Exceptional 84.1% |
| Cypriots | 99.9 /100 | #15 | Exceptional 84.1% |