Immigrants from Oceania vs Hopi In Labor Force | Age 30-34
COMPARE
Immigrants from Oceania
Hopi
In Labor Force | Age 30-34
In Labor Force | Age 30-34 Comparison
Immigrants from Oceania
Hopi
84.0%
IN LABOR FORCE | AGE 30-34
1.1/ 100
METRIC RATING
242nd/ 347
METRIC RANK
79.3%
IN LABOR FORCE | AGE 30-34
0.0/ 100
METRIC RATING
334th/ 347
METRIC RANK
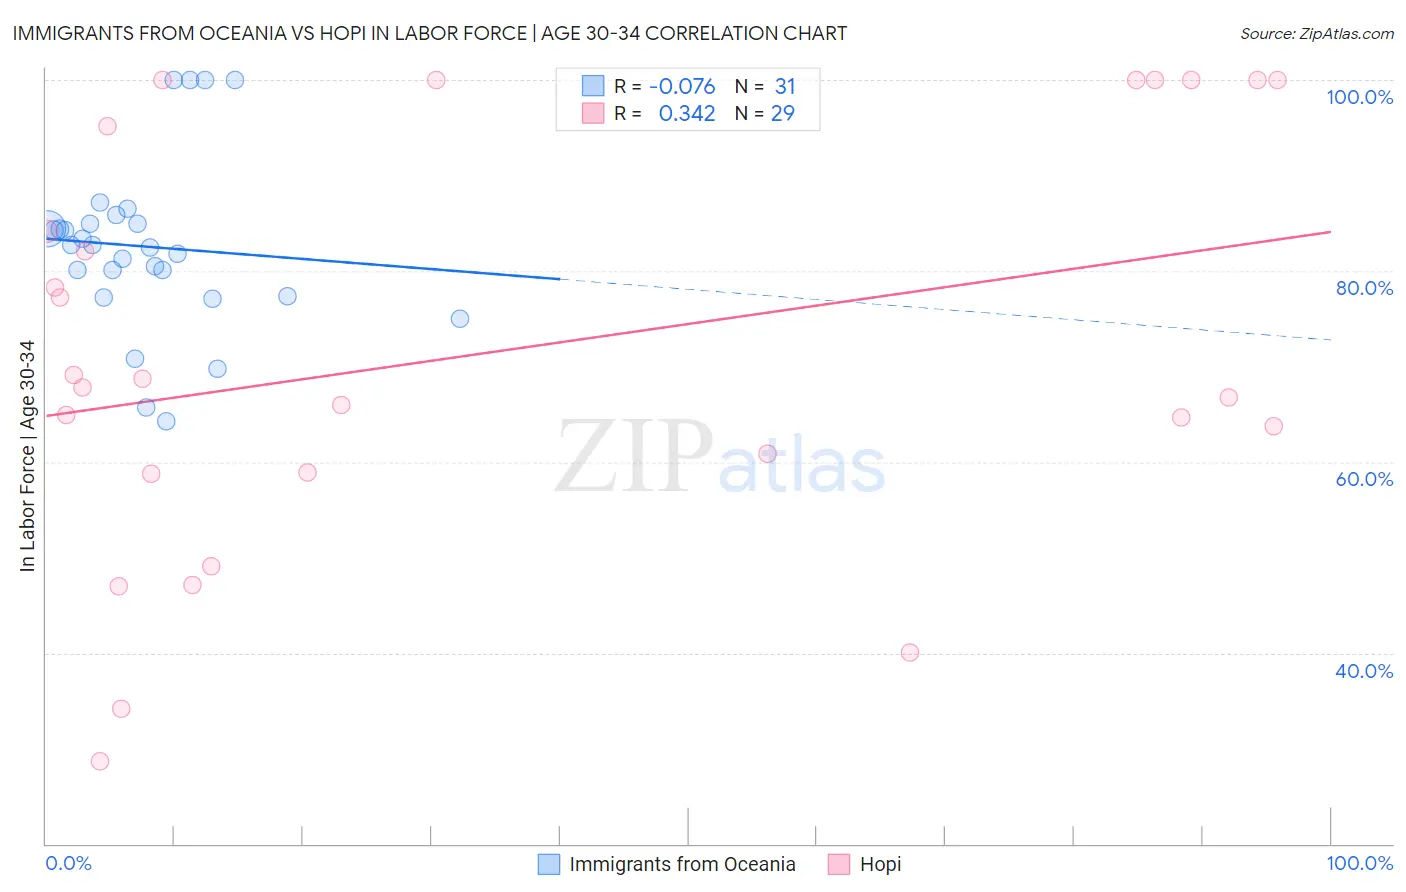
Immigrants from Oceania vs Hopi In Labor Force | Age 30-34 Correlation Chart
The statistical analysis conducted on geographies consisting of 305,403,957 people shows a slight negative correlation between the proportion of Immigrants from Oceania and labor force participation rate among population between the ages 30 and 34 in the United States with a correlation coefficient (R) of -0.076 and weighted average of 84.0%. Similarly, the statistical analysis conducted on geographies consisting of 74,731,865 people shows a mild positive correlation between the proportion of Hopi and labor force participation rate among population between the ages 30 and 34 in the United States with a correlation coefficient (R) of 0.342 and weighted average of 79.3%, a difference of 6.0%.
In Labor Force | Age 30-34 Correlation Summary
| Measurement | Immigrants from Oceania | Hopi |
| Minimum | 64.3% | 28.6% |
| Maximum | 100.0% | 100.0% |
| Range | 35.7% | 71.4% |
| Mean | 82.5% | 71.5% |
| Median | 82.7% | 67.8% |
| Interquartile 25% (IQ1) | 77.3% | 58.9% |
| Interquartile 75% (IQ3) | 84.9% | 97.6% |
| Interquartile Range (IQR) | 7.6% | 38.7% |
| Standard Deviation (Sample) | 8.9% | 21.7% |
| Standard Deviation (Population) | 8.8% | 21.3% |
Similar Demographics by In Labor Force | Age 30-34
Demographics Similar to Immigrants from Oceania by In Labor Force | Age 30-34
In terms of in labor force | age 30-34, the demographic groups most similar to Immigrants from Oceania are Immigrants from Portugal (84.0%, a difference of 0.010%), Immigrants from Caribbean (84.0%, a difference of 0.010%), English (84.0%, a difference of 0.030%), Venezuelan (84.0%, a difference of 0.030%), and Celtic (84.1%, a difference of 0.040%).
| Demographics | Rating | Rank | In Labor Force | Age 30-34 |
| French American Indians | 1.7 /100 | #235 | Tragic 84.1% |
| U.S. Virgin Islanders | 1.5 /100 | #236 | Tragic 84.1% |
| Celtics | 1.4 /100 | #237 | Tragic 84.1% |
| Immigrants | Barbados | 1.4 /100 | #238 | Tragic 84.0% |
| English | 1.4 /100 | #239 | Tragic 84.0% |
| Venezuelans | 1.3 /100 | #240 | Tragic 84.0% |
| Immigrants | Portugal | 1.2 /100 | #241 | Tragic 84.0% |
| Immigrants | Oceania | 1.1 /100 | #242 | Tragic 84.0% |
| Immigrants | Caribbean | 1.1 /100 | #243 | Tragic 84.0% |
| Basques | 0.9 /100 | #244 | Tragic 84.0% |
| Immigrants | Venezuela | 0.9 /100 | #245 | Tragic 84.0% |
| Central Americans | 0.9 /100 | #246 | Tragic 84.0% |
| British West Indians | 0.8 /100 | #247 | Tragic 84.0% |
| Portuguese | 0.8 /100 | #248 | Tragic 84.0% |
| Immigrants | Dominica | 0.7 /100 | #249 | Tragic 84.0% |
Demographics Similar to Hopi by In Labor Force | Age 30-34
In terms of in labor force | age 30-34, the demographic groups most similar to Hopi are Marshallese (79.2%, a difference of 0.030%), Native/Alaskan (79.2%, a difference of 0.12%), Yakama (79.1%, a difference of 0.15%), Pima (79.0%, a difference of 0.28%), and Apache (79.0%, a difference of 0.30%).
| Demographics | Rating | Rank | In Labor Force | Age 30-34 |
| Colville | 0.0 /100 | #327 | Tragic 80.7% |
| Sioux | 0.0 /100 | #328 | Tragic 80.4% |
| Creek | 0.0 /100 | #329 | Tragic 80.4% |
| Pueblo | 0.0 /100 | #330 | Tragic 80.0% |
| Houma | 0.0 /100 | #331 | Tragic 79.9% |
| Kiowa | 0.0 /100 | #332 | Tragic 79.8% |
| Inupiat | 0.0 /100 | #333 | Tragic 79.7% |
| Hopi | 0.0 /100 | #334 | Tragic 79.3% |
| Marshallese | 0.0 /100 | #335 | Tragic 79.2% |
| Natives/Alaskans | 0.0 /100 | #336 | Tragic 79.2% |
| Yakama | 0.0 /100 | #337 | Tragic 79.1% |
| Pima | 0.0 /100 | #338 | Tragic 79.0% |
| Apache | 0.0 /100 | #339 | Tragic 79.0% |
| Ute | 0.0 /100 | #340 | Tragic 78.9% |
| Immigrants | Yemen | 0.0 /100 | #341 | Tragic 78.2% |