Immigrants from Oceania vs Immigrants from Eastern Asia In Labor Force | Age 30-34
COMPARE
Immigrants from Oceania
Immigrants from Eastern Asia
In Labor Force | Age 30-34
In Labor Force | Age 30-34 Comparison
Immigrants from Oceania
Immigrants from Eastern Asia
84.0%
IN LABOR FORCE | AGE 30-34
1.1/ 100
METRIC RATING
242nd/ 347
METRIC RANK
85.4%
IN LABOR FORCE | AGE 30-34
98.9/ 100
METRIC RATING
77th/ 347
METRIC RANK
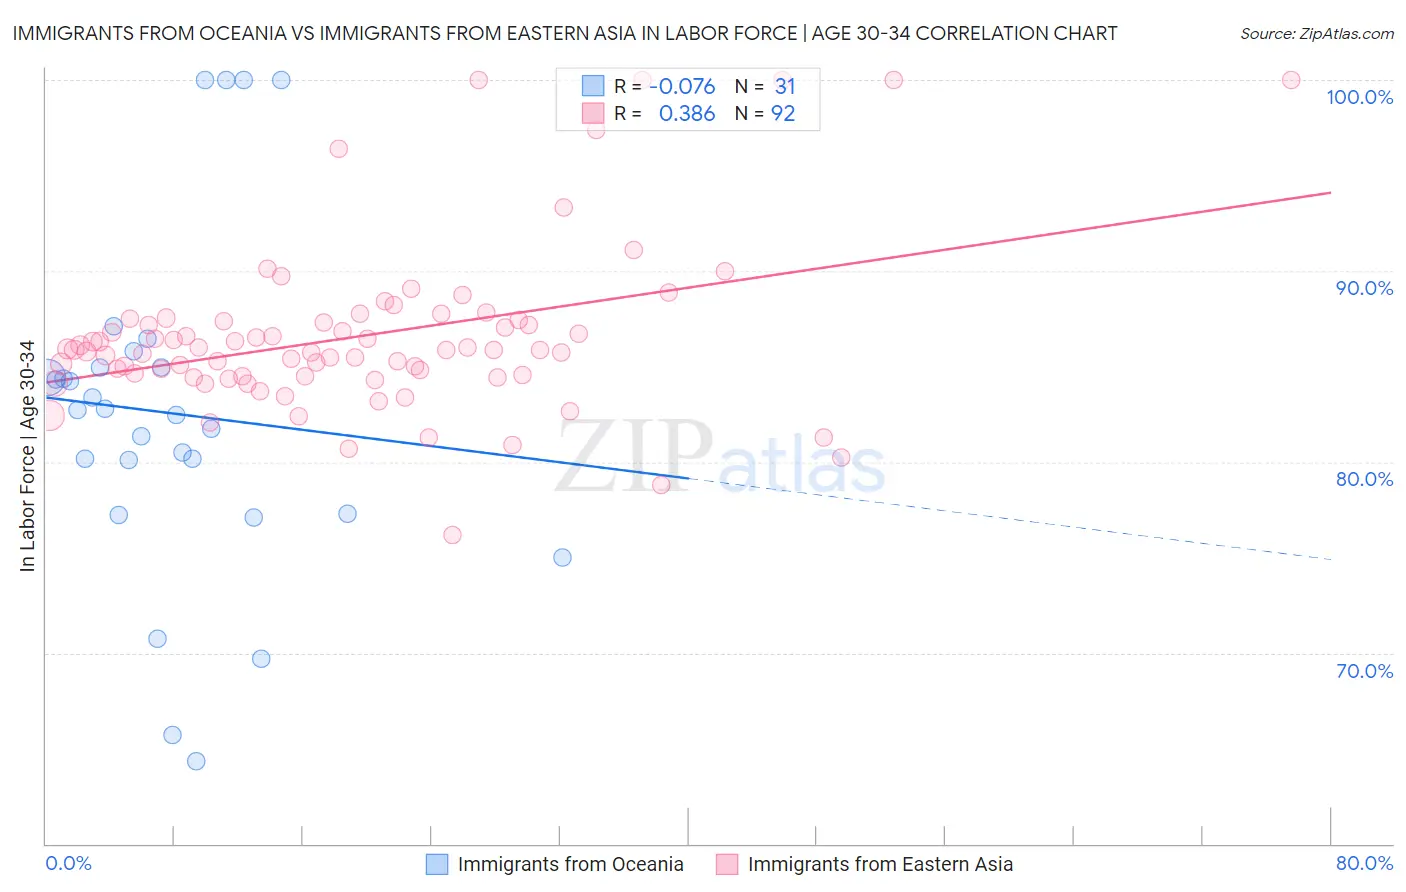
Immigrants from Oceania vs Immigrants from Eastern Asia In Labor Force | Age 30-34 Correlation Chart
The statistical analysis conducted on geographies consisting of 305,403,957 people shows a slight negative correlation between the proportion of Immigrants from Oceania and labor force participation rate among population between the ages 30 and 34 in the United States with a correlation coefficient (R) of -0.076 and weighted average of 84.0%. Similarly, the statistical analysis conducted on geographies consisting of 499,420,664 people shows a mild positive correlation between the proportion of Immigrants from Eastern Asia and labor force participation rate among population between the ages 30 and 34 in the United States with a correlation coefficient (R) of 0.386 and weighted average of 85.4%, a difference of 1.6%.
In Labor Force | Age 30-34 Correlation Summary
| Measurement | Immigrants from Oceania | Immigrants from Eastern Asia |
| Minimum | 64.3% | 76.2% |
| Maximum | 100.0% | 100.0% |
| Range | 35.7% | 23.8% |
| Mean | 82.5% | 86.6% |
| Median | 82.7% | 85.9% |
| Interquartile 25% (IQ1) | 77.3% | 84.5% |
| Interquartile 75% (IQ3) | 84.9% | 87.4% |
| Interquartile Range (IQR) | 7.6% | 2.9% |
| Standard Deviation (Sample) | 8.9% | 4.4% |
| Standard Deviation (Population) | 8.8% | 4.4% |
Similar Demographics by In Labor Force | Age 30-34
Demographics Similar to Immigrants from Oceania by In Labor Force | Age 30-34
In terms of in labor force | age 30-34, the demographic groups most similar to Immigrants from Oceania are Immigrants from Portugal (84.0%, a difference of 0.010%), Immigrants from Caribbean (84.0%, a difference of 0.010%), English (84.0%, a difference of 0.030%), Venezuelan (84.0%, a difference of 0.030%), and Celtic (84.1%, a difference of 0.040%).
| Demographics | Rating | Rank | In Labor Force | Age 30-34 |
| French American Indians | 1.7 /100 | #235 | Tragic 84.1% |
| U.S. Virgin Islanders | 1.5 /100 | #236 | Tragic 84.1% |
| Celtics | 1.4 /100 | #237 | Tragic 84.1% |
| Immigrants | Barbados | 1.4 /100 | #238 | Tragic 84.0% |
| English | 1.4 /100 | #239 | Tragic 84.0% |
| Venezuelans | 1.3 /100 | #240 | Tragic 84.0% |
| Immigrants | Portugal | 1.2 /100 | #241 | Tragic 84.0% |
| Immigrants | Oceania | 1.1 /100 | #242 | Tragic 84.0% |
| Immigrants | Caribbean | 1.1 /100 | #243 | Tragic 84.0% |
| Basques | 0.9 /100 | #244 | Tragic 84.0% |
| Immigrants | Venezuela | 0.9 /100 | #245 | Tragic 84.0% |
| Central Americans | 0.9 /100 | #246 | Tragic 84.0% |
| British West Indians | 0.8 /100 | #247 | Tragic 84.0% |
| Portuguese | 0.8 /100 | #248 | Tragic 84.0% |
| Immigrants | Dominica | 0.7 /100 | #249 | Tragic 84.0% |
Demographics Similar to Immigrants from Eastern Asia by In Labor Force | Age 30-34
In terms of in labor force | age 30-34, the demographic groups most similar to Immigrants from Eastern Asia are Immigrants from Czechoslovakia (85.4%, a difference of 0.010%), Iranian (85.4%, a difference of 0.010%), Brazilian (85.4%, a difference of 0.020%), Immigrants from Japan (85.4%, a difference of 0.020%), and Immigrants from China (85.4%, a difference of 0.020%).
| Demographics | Rating | Rank | In Labor Force | Age 30-34 |
| Brazilians | 99.1 /100 | #70 | Exceptional 85.4% |
| Immigrants | Japan | 99.1 /100 | #71 | Exceptional 85.4% |
| Immigrants | China | 99.0 /100 | #72 | Exceptional 85.4% |
| Indians (Asian) | 99.0 /100 | #73 | Exceptional 85.4% |
| Maltese | 99.0 /100 | #74 | Exceptional 85.4% |
| Immigrants | Czechoslovakia | 99.0 /100 | #75 | Exceptional 85.4% |
| Iranians | 99.0 /100 | #76 | Exceptional 85.4% |
| Immigrants | Eastern Asia | 98.9 /100 | #77 | Exceptional 85.4% |
| Immigrants | Singapore | 98.8 /100 | #78 | Exceptional 85.3% |
| Immigrants | Switzerland | 98.7 /100 | #79 | Exceptional 85.3% |
| Immigrants | Russia | 98.7 /100 | #80 | Exceptional 85.3% |
| Slovaks | 98.7 /100 | #81 | Exceptional 85.3% |
| Immigrants | Africa | 98.6 /100 | #82 | Exceptional 85.3% |
| Immigrants | Europe | 98.6 /100 | #83 | Exceptional 85.3% |
| Greeks | 98.6 /100 | #84 | Exceptional 85.3% |