Immigrants from Oceania vs Marshallese In Labor Force | Age 30-34
COMPARE
Immigrants from Oceania
Marshallese
In Labor Force | Age 30-34
In Labor Force | Age 30-34 Comparison
Immigrants from Oceania
Marshallese
84.0%
IN LABOR FORCE | AGE 30-34
1.1/ 100
METRIC RATING
242nd/ 347
METRIC RANK
79.2%
IN LABOR FORCE | AGE 30-34
0.0/ 100
METRIC RATING
335th/ 347
METRIC RANK
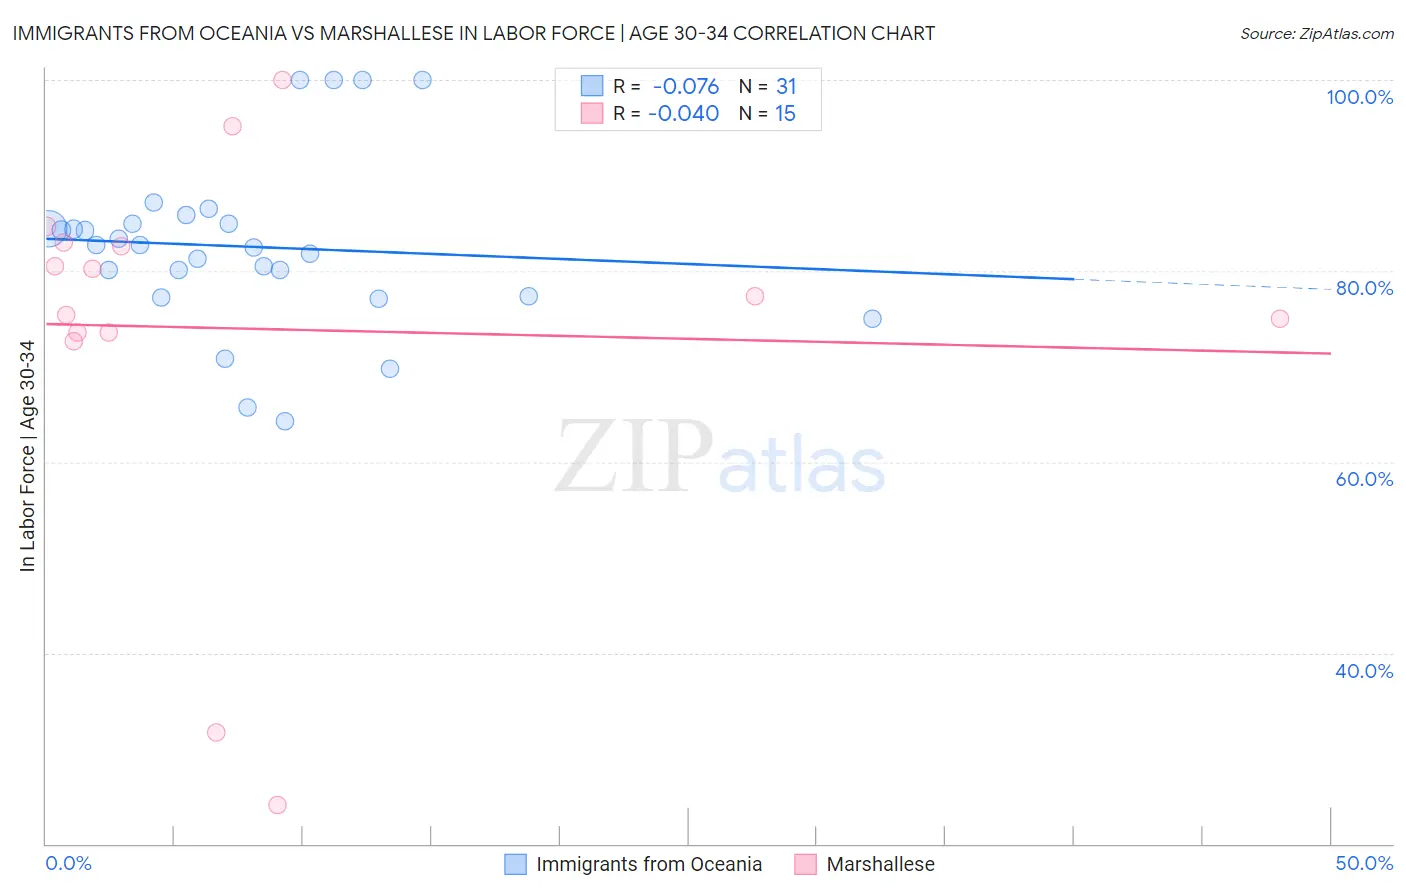
Immigrants from Oceania vs Marshallese In Labor Force | Age 30-34 Correlation Chart
The statistical analysis conducted on geographies consisting of 305,403,957 people shows a slight negative correlation between the proportion of Immigrants from Oceania and labor force participation rate among population between the ages 30 and 34 in the United States with a correlation coefficient (R) of -0.076 and weighted average of 84.0%. Similarly, the statistical analysis conducted on geographies consisting of 14,760,991 people shows no correlation between the proportion of Marshallese and labor force participation rate among population between the ages 30 and 34 in the United States with a correlation coefficient (R) of -0.040 and weighted average of 79.2%, a difference of 6.0%.
In Labor Force | Age 30-34 Correlation Summary
| Measurement | Immigrants from Oceania | Marshallese |
| Minimum | 64.3% | 24.0% |
| Maximum | 100.0% | 100.0% |
| Range | 35.7% | 76.0% |
| Mean | 82.5% | 73.9% |
| Median | 82.7% | 77.3% |
| Interquartile 25% (IQ1) | 77.3% | 73.5% |
| Interquartile 75% (IQ3) | 84.9% | 82.9% |
| Interquartile Range (IQR) | 7.6% | 9.4% |
| Standard Deviation (Sample) | 8.9% | 20.3% |
| Standard Deviation (Population) | 8.8% | 19.6% |
Similar Demographics by In Labor Force | Age 30-34
Demographics Similar to Immigrants from Oceania by In Labor Force | Age 30-34
In terms of in labor force | age 30-34, the demographic groups most similar to Immigrants from Oceania are Immigrants from Portugal (84.0%, a difference of 0.010%), Immigrants from Caribbean (84.0%, a difference of 0.010%), English (84.0%, a difference of 0.030%), Venezuelan (84.0%, a difference of 0.030%), and Celtic (84.1%, a difference of 0.040%).
| Demographics | Rating | Rank | In Labor Force | Age 30-34 |
| French American Indians | 1.7 /100 | #235 | Tragic 84.1% |
| U.S. Virgin Islanders | 1.5 /100 | #236 | Tragic 84.1% |
| Celtics | 1.4 /100 | #237 | Tragic 84.1% |
| Immigrants | Barbados | 1.4 /100 | #238 | Tragic 84.0% |
| English | 1.4 /100 | #239 | Tragic 84.0% |
| Venezuelans | 1.3 /100 | #240 | Tragic 84.0% |
| Immigrants | Portugal | 1.2 /100 | #241 | Tragic 84.0% |
| Immigrants | Oceania | 1.1 /100 | #242 | Tragic 84.0% |
| Immigrants | Caribbean | 1.1 /100 | #243 | Tragic 84.0% |
| Basques | 0.9 /100 | #244 | Tragic 84.0% |
| Immigrants | Venezuela | 0.9 /100 | #245 | Tragic 84.0% |
| Central Americans | 0.9 /100 | #246 | Tragic 84.0% |
| British West Indians | 0.8 /100 | #247 | Tragic 84.0% |
| Portuguese | 0.8 /100 | #248 | Tragic 84.0% |
| Immigrants | Dominica | 0.7 /100 | #249 | Tragic 84.0% |
Demographics Similar to Marshallese by In Labor Force | Age 30-34
In terms of in labor force | age 30-34, the demographic groups most similar to Marshallese are Hopi (79.3%, a difference of 0.030%), Native/Alaskan (79.2%, a difference of 0.080%), Yakama (79.1%, a difference of 0.12%), Pima (79.0%, a difference of 0.24%), and Apache (79.0%, a difference of 0.27%).
| Demographics | Rating | Rank | In Labor Force | Age 30-34 |
| Sioux | 0.0 /100 | #328 | Tragic 80.4% |
| Creek | 0.0 /100 | #329 | Tragic 80.4% |
| Pueblo | 0.0 /100 | #330 | Tragic 80.0% |
| Houma | 0.0 /100 | #331 | Tragic 79.9% |
| Kiowa | 0.0 /100 | #332 | Tragic 79.8% |
| Inupiat | 0.0 /100 | #333 | Tragic 79.7% |
| Hopi | 0.0 /100 | #334 | Tragic 79.3% |
| Marshallese | 0.0 /100 | #335 | Tragic 79.2% |
| Natives/Alaskans | 0.0 /100 | #336 | Tragic 79.2% |
| Yakama | 0.0 /100 | #337 | Tragic 79.1% |
| Pima | 0.0 /100 | #338 | Tragic 79.0% |
| Apache | 0.0 /100 | #339 | Tragic 79.0% |
| Ute | 0.0 /100 | #340 | Tragic 78.9% |
| Immigrants | Yemen | 0.0 /100 | #341 | Tragic 78.2% |
| Tohono O'odham | 0.0 /100 | #342 | Tragic 77.7% |