Immigrants from Norway vs Immigrants In Labor Force | Age 25-29
COMPARE
Immigrants from Norway
Immigrants
In Labor Force | Age 25-29
In Labor Force | Age 25-29 Comparison
Immigrants from Norway
Immigrants
84.6%
IN LABOR FORCE | AGE 25-29
41.9/ 100
METRIC RATING
181st/ 347
METRIC RANK
83.9%
IN LABOR FORCE | AGE 25-29
0.9/ 100
METRIC RATING
237th/ 347
METRIC RANK
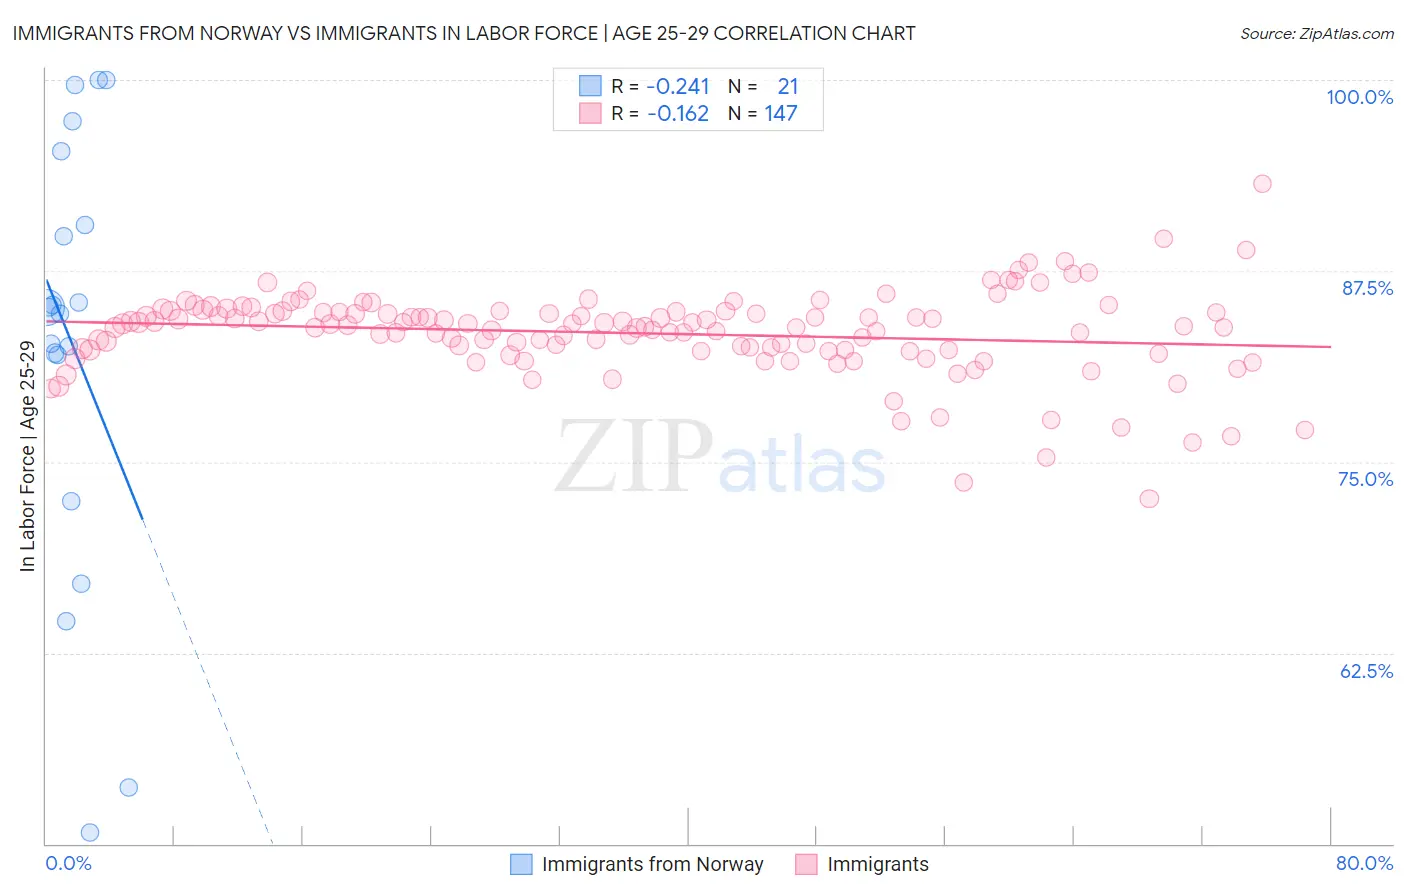
Immigrants from Norway vs Immigrants In Labor Force | Age 25-29 Correlation Chart
The statistical analysis conducted on geographies consisting of 116,700,370 people shows a weak negative correlation between the proportion of Immigrants from Norway and labor force participation rate among population between the ages 25 and 29 in the United States with a correlation coefficient (R) of -0.241 and weighted average of 84.6%. Similarly, the statistical analysis conducted on geographies consisting of 576,264,876 people shows a poor negative correlation between the proportion of Immigrants and labor force participation rate among population between the ages 25 and 29 in the United States with a correlation coefficient (R) of -0.162 and weighted average of 83.9%, a difference of 0.81%.
In Labor Force | Age 25-29 Correlation Summary
| Measurement | Immigrants from Norway | Immigrants |
| Minimum | 50.7% | 72.6% |
| Maximum | 100.0% | 93.2% |
| Range | 49.3% | 20.6% |
| Mean | 82.7% | 83.4% |
| Median | 85.1% | 83.9% |
| Interquartile 25% (IQ1) | 77.2% | 82.3% |
| Interquartile 75% (IQ3) | 92.9% | 84.8% |
| Interquartile Range (IQR) | 15.7% | 2.5% |
| Standard Deviation (Sample) | 14.1% | 2.8% |
| Standard Deviation (Population) | 13.7% | 2.8% |
Similar Demographics by In Labor Force | Age 25-29
Demographics Similar to Immigrants from Norway by In Labor Force | Age 25-29
In terms of in labor force | age 25-29, the demographic groups most similar to Immigrants from Norway are Immigrants from South America (84.6%, a difference of 0.010%), European (84.6%, a difference of 0.010%), Scottish (84.6%, a difference of 0.010%), Immigrants from Argentina (84.6%, a difference of 0.020%), and Immigrants from China (84.6%, a difference of 0.030%).
| Demographics | Rating | Rank | In Labor Force | Age 25-29 |
| Palestinians | 50.0 /100 | #174 | Average 84.7% |
| Hungarians | 47.8 /100 | #175 | Average 84.6% |
| Malaysians | 46.8 /100 | #176 | Average 84.6% |
| Immigrants | China | 45.7 /100 | #177 | Average 84.6% |
| Immigrants | Thailand | 45.2 /100 | #178 | Average 84.6% |
| Immigrants | Argentina | 44.0 /100 | #179 | Average 84.6% |
| Immigrants | South America | 42.9 /100 | #180 | Average 84.6% |
| Immigrants | Norway | 41.9 /100 | #181 | Average 84.6% |
| Europeans | 40.3 /100 | #182 | Average 84.6% |
| Scottish | 40.1 /100 | #183 | Average 84.6% |
| Immigrants | Kuwait | 38.2 /100 | #184 | Fair 84.6% |
| Immigrants | Denmark | 37.0 /100 | #185 | Fair 84.6% |
| Immigrants | Belgium | 35.0 /100 | #186 | Fair 84.6% |
| Immigrants | Portugal | 34.7 /100 | #187 | Fair 84.6% |
| Immigrants | Ukraine | 33.7 /100 | #188 | Fair 84.5% |
Demographics Similar to Immigrants by In Labor Force | Age 25-29
In terms of in labor force | age 25-29, the demographic groups most similar to Immigrants are Guamanian/Chamorro (83.9%, a difference of 0.0%), Iraqi (83.9%, a difference of 0.010%), Barbadian (83.9%, a difference of 0.030%), Immigrants from Uzbekistan (83.9%, a difference of 0.030%), and Jamaican (83.9%, a difference of 0.030%).
| Demographics | Rating | Rank | In Labor Force | Age 25-29 |
| Whites/Caucasians | 4.8 /100 | #230 | Tragic 84.2% |
| Immigrants | Philippines | 4.7 /100 | #231 | Tragic 84.2% |
| Panamanians | 4.5 /100 | #232 | Tragic 84.2% |
| Immigrants | Western Asia | 2.7 /100 | #233 | Tragic 84.1% |
| Barbadians | 1.0 /100 | #234 | Tragic 83.9% |
| Iraqis | 0.9 /100 | #235 | Tragic 83.9% |
| Guamanians/Chamorros | 0.9 /100 | #236 | Tragic 83.9% |
| Immigrants | Immigrants | 0.9 /100 | #237 | Tragic 83.9% |
| Immigrants | Uzbekistan | 0.8 /100 | #238 | Tragic 83.9% |
| Jamaicans | 0.8 /100 | #239 | Tragic 83.9% |
| Trinidadians and Tobagonians | 0.7 /100 | #240 | Tragic 83.9% |
| Alsatians | 0.7 /100 | #241 | Tragic 83.9% |
| U.S. Virgin Islanders | 0.6 /100 | #242 | Tragic 83.8% |
| Salvadorans | 0.5 /100 | #243 | Tragic 83.8% |
| Immigrants | Jamaica | 0.4 /100 | #244 | Tragic 83.8% |