Immigrants from Syria vs Immigrants In Labor Force | Age 25-29
COMPARE
Immigrants from Syria
Immigrants
In Labor Force | Age 25-29
In Labor Force | Age 25-29 Comparison
Immigrants from Syria
Immigrants
84.3%
IN LABOR FORCE | AGE 25-29
10.7/ 100
METRIC RATING
215th/ 347
METRIC RANK
83.9%
IN LABOR FORCE | AGE 25-29
0.9/ 100
METRIC RATING
237th/ 347
METRIC RANK
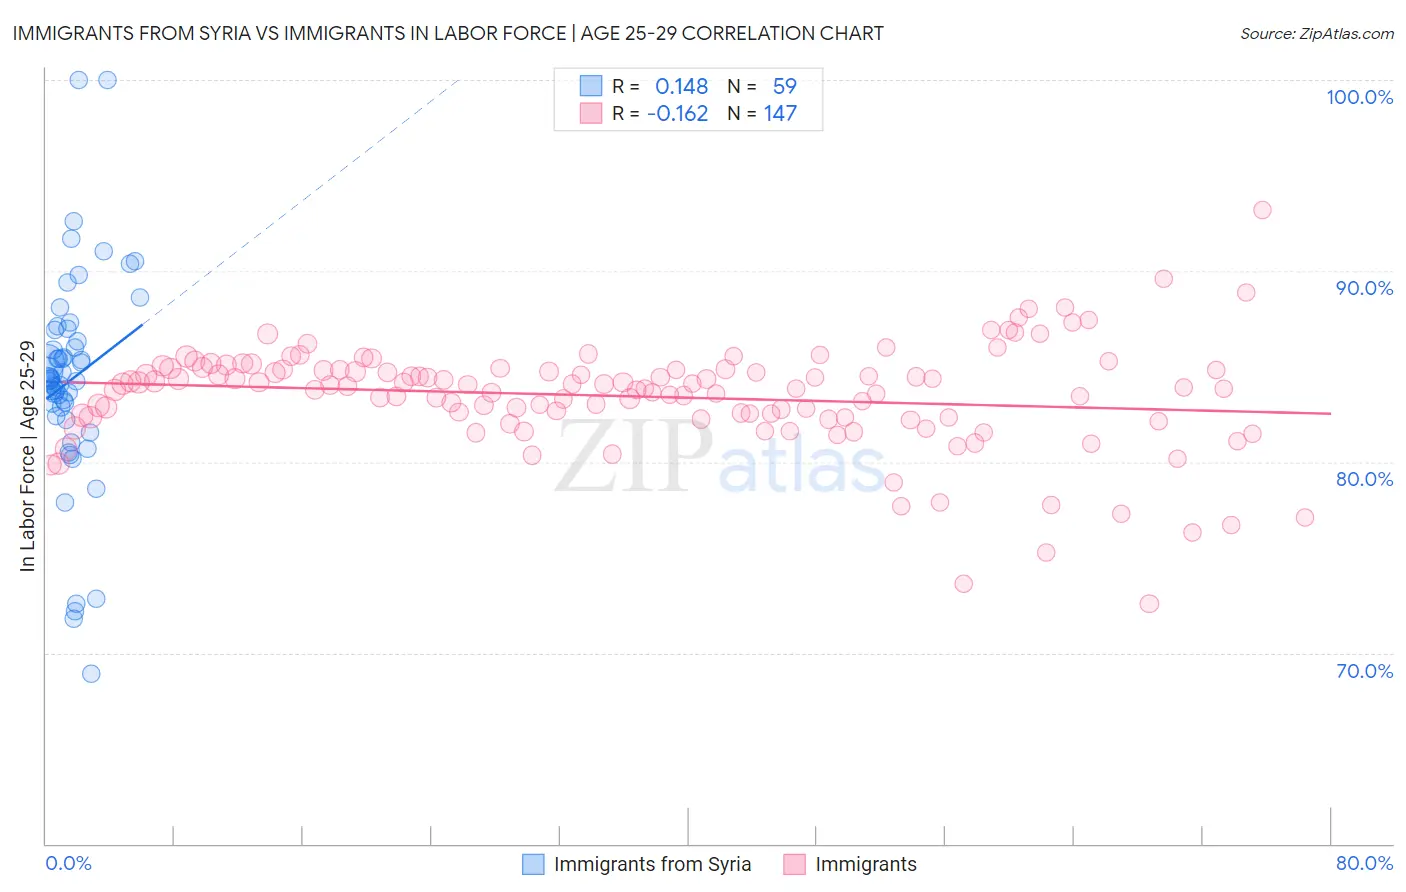
Immigrants from Syria vs Immigrants In Labor Force | Age 25-29 Correlation Chart
The statistical analysis conducted on geographies consisting of 174,092,146 people shows a poor positive correlation between the proportion of Immigrants from Syria and labor force participation rate among population between the ages 25 and 29 in the United States with a correlation coefficient (R) of 0.148 and weighted average of 84.3%. Similarly, the statistical analysis conducted on geographies consisting of 576,264,876 people shows a poor negative correlation between the proportion of Immigrants and labor force participation rate among population between the ages 25 and 29 in the United States with a correlation coefficient (R) of -0.162 and weighted average of 83.9%, a difference of 0.48%.
In Labor Force | Age 25-29 Correlation Summary
| Measurement | Immigrants from Syria | Immigrants |
| Minimum | 68.9% | 72.6% |
| Maximum | 100.0% | 93.2% |
| Range | 31.1% | 20.6% |
| Mean | 84.3% | 83.4% |
| Median | 84.4% | 83.9% |
| Interquartile 25% (IQ1) | 82.4% | 82.3% |
| Interquartile 75% (IQ3) | 86.9% | 84.8% |
| Interquartile Range (IQR) | 4.6% | 2.5% |
| Standard Deviation (Sample) | 5.7% | 2.8% |
| Standard Deviation (Population) | 5.6% | 2.8% |
Similar Demographics by In Labor Force | Age 25-29
Demographics Similar to Immigrants from Syria by In Labor Force | Age 25-29
In terms of in labor force | age 25-29, the demographic groups most similar to Immigrants from Syria are Japanese (84.3%, a difference of 0.010%), Lebanese (84.3%, a difference of 0.010%), Subsaharan African (84.3%, a difference of 0.020%), Chinese (84.3%, a difference of 0.030%), and Immigrants from Venezuela (84.3%, a difference of 0.030%).
| Demographics | Rating | Rank | In Labor Force | Age 25-29 |
| Immigrants | Indonesia | 13.2 /100 | #208 | Poor 84.4% |
| Immigrants | Jordan | 12.8 /100 | #209 | Poor 84.4% |
| Chinese | 12.7 /100 | #210 | Poor 84.3% |
| Immigrants | Venezuela | 12.6 /100 | #211 | Poor 84.3% |
| Sub-Saharan Africans | 11.7 /100 | #212 | Poor 84.3% |
| Japanese | 11.4 /100 | #213 | Poor 84.3% |
| Lebanese | 11.1 /100 | #214 | Poor 84.3% |
| Immigrants | Syria | 10.7 /100 | #215 | Poor 84.3% |
| Israelis | 9.3 /100 | #216 | Tragic 84.3% |
| Immigrants | Ecuador | 9.3 /100 | #217 | Tragic 84.3% |
| Immigrants | Nigeria | 9.0 /100 | #218 | Tragic 84.3% |
| Immigrants | Saudi Arabia | 8.8 /100 | #219 | Tragic 84.3% |
| Nigerians | 7.2 /100 | #220 | Tragic 84.3% |
| Arabs | 6.8 /100 | #221 | Tragic 84.2% |
| Jordanians | 6.7 /100 | #222 | Tragic 84.2% |
Demographics Similar to Immigrants by In Labor Force | Age 25-29
In terms of in labor force | age 25-29, the demographic groups most similar to Immigrants are Guamanian/Chamorro (83.9%, a difference of 0.0%), Iraqi (83.9%, a difference of 0.010%), Barbadian (83.9%, a difference of 0.030%), Immigrants from Uzbekistan (83.9%, a difference of 0.030%), and Jamaican (83.9%, a difference of 0.030%).
| Demographics | Rating | Rank | In Labor Force | Age 25-29 |
| Whites/Caucasians | 4.8 /100 | #230 | Tragic 84.2% |
| Immigrants | Philippines | 4.7 /100 | #231 | Tragic 84.2% |
| Panamanians | 4.5 /100 | #232 | Tragic 84.2% |
| Immigrants | Western Asia | 2.7 /100 | #233 | Tragic 84.1% |
| Barbadians | 1.0 /100 | #234 | Tragic 83.9% |
| Iraqis | 0.9 /100 | #235 | Tragic 83.9% |
| Guamanians/Chamorros | 0.9 /100 | #236 | Tragic 83.9% |
| Immigrants | Immigrants | 0.9 /100 | #237 | Tragic 83.9% |
| Immigrants | Uzbekistan | 0.8 /100 | #238 | Tragic 83.9% |
| Jamaicans | 0.8 /100 | #239 | Tragic 83.9% |
| Trinidadians and Tobagonians | 0.7 /100 | #240 | Tragic 83.9% |
| Alsatians | 0.7 /100 | #241 | Tragic 83.9% |
| U.S. Virgin Islanders | 0.6 /100 | #242 | Tragic 83.8% |
| Salvadorans | 0.5 /100 | #243 | Tragic 83.8% |
| Immigrants | Jamaica | 0.4 /100 | #244 | Tragic 83.8% |