Immigrants from Norway vs Immigrants from South Africa In Labor Force | Age 25-29
COMPARE
Immigrants from Norway
Immigrants from South Africa
In Labor Force | Age 25-29
In Labor Force | Age 25-29 Comparison
Immigrants from Norway
Immigrants from South Africa
84.6%
IN LABOR FORCE | AGE 25-29
41.9/ 100
METRIC RATING
181st/ 347
METRIC RANK
84.9%
IN LABOR FORCE | AGE 25-29
86.1/ 100
METRIC RATING
120th/ 347
METRIC RANK
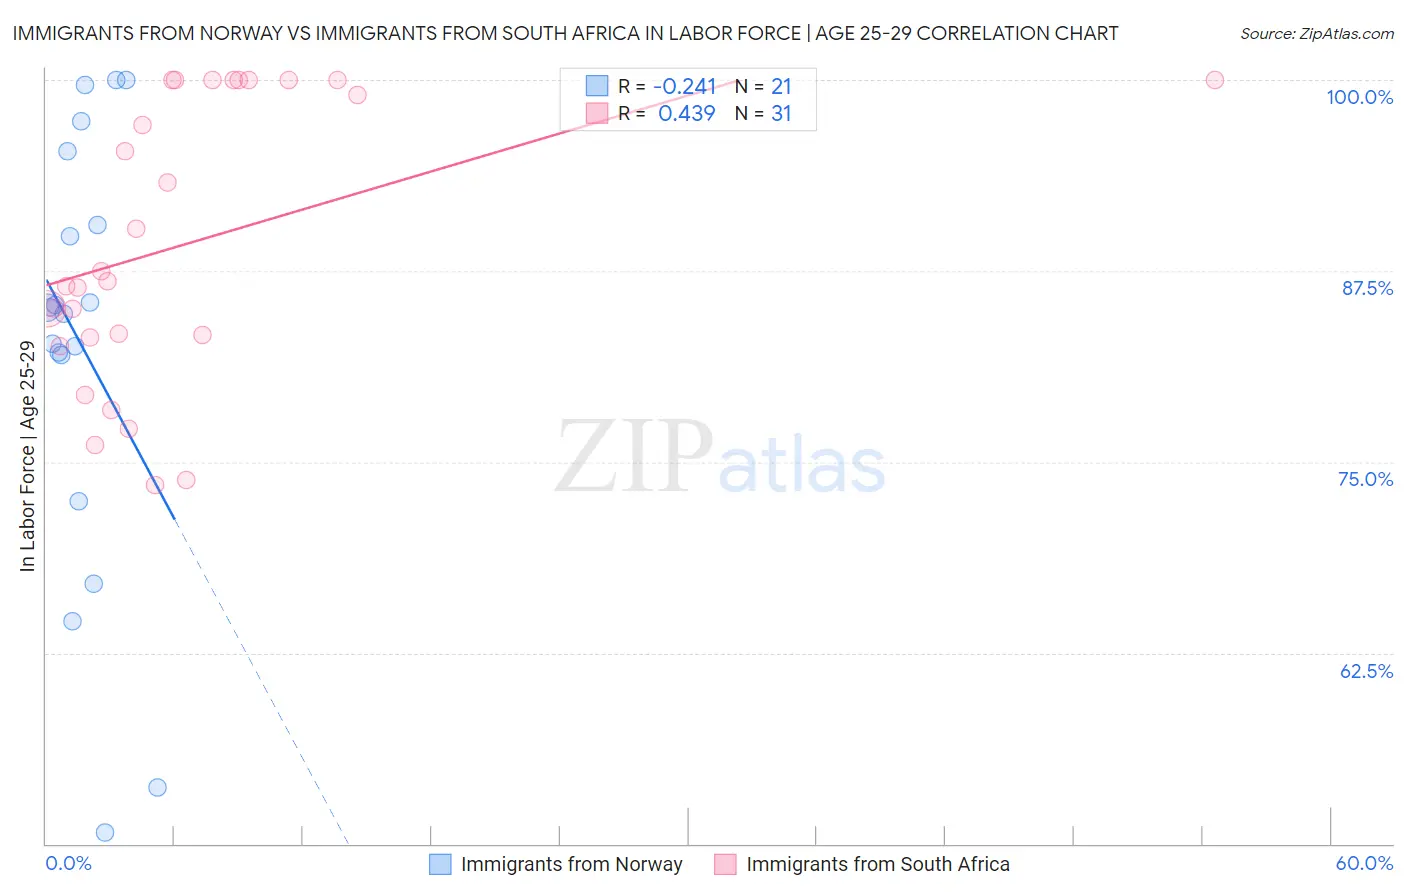
Immigrants from Norway vs Immigrants from South Africa In Labor Force | Age 25-29 Correlation Chart
The statistical analysis conducted on geographies consisting of 116,700,370 people shows a weak negative correlation between the proportion of Immigrants from Norway and labor force participation rate among population between the ages 25 and 29 in the United States with a correlation coefficient (R) of -0.241 and weighted average of 84.6%. Similarly, the statistical analysis conducted on geographies consisting of 233,262,350 people shows a moderate positive correlation between the proportion of Immigrants from South Africa and labor force participation rate among population between the ages 25 and 29 in the United States with a correlation coefficient (R) of 0.439 and weighted average of 84.9%, a difference of 0.40%.
In Labor Force | Age 25-29 Correlation Summary
| Measurement | Immigrants from Norway | Immigrants from South Africa |
| Minimum | 50.7% | 73.5% |
| Maximum | 100.0% | 100.0% |
| Range | 49.3% | 26.5% |
| Mean | 82.7% | 89.3% |
| Median | 85.1% | 86.8% |
| Interquartile 25% (IQ1) | 77.2% | 83.1% |
| Interquartile 75% (IQ3) | 92.9% | 100.0% |
| Interquartile Range (IQR) | 15.7% | 16.9% |
| Standard Deviation (Sample) | 14.1% | 9.1% |
| Standard Deviation (Population) | 13.7% | 9.0% |
Similar Demographics by In Labor Force | Age 25-29
Demographics Similar to Immigrants from Norway by In Labor Force | Age 25-29
In terms of in labor force | age 25-29, the demographic groups most similar to Immigrants from Norway are Immigrants from South America (84.6%, a difference of 0.010%), European (84.6%, a difference of 0.010%), Scottish (84.6%, a difference of 0.010%), Immigrants from Argentina (84.6%, a difference of 0.020%), and Immigrants from China (84.6%, a difference of 0.030%).
| Demographics | Rating | Rank | In Labor Force | Age 25-29 |
| Palestinians | 50.0 /100 | #174 | Average 84.7% |
| Hungarians | 47.8 /100 | #175 | Average 84.6% |
| Malaysians | 46.8 /100 | #176 | Average 84.6% |
| Immigrants | China | 45.7 /100 | #177 | Average 84.6% |
| Immigrants | Thailand | 45.2 /100 | #178 | Average 84.6% |
| Immigrants | Argentina | 44.0 /100 | #179 | Average 84.6% |
| Immigrants | South America | 42.9 /100 | #180 | Average 84.6% |
| Immigrants | Norway | 41.9 /100 | #181 | Average 84.6% |
| Europeans | 40.3 /100 | #182 | Average 84.6% |
| Scottish | 40.1 /100 | #183 | Average 84.6% |
| Immigrants | Kuwait | 38.2 /100 | #184 | Fair 84.6% |
| Immigrants | Denmark | 37.0 /100 | #185 | Fair 84.6% |
| Immigrants | Belgium | 35.0 /100 | #186 | Fair 84.6% |
| Immigrants | Portugal | 34.7 /100 | #187 | Fair 84.6% |
| Immigrants | Ukraine | 33.7 /100 | #188 | Fair 84.5% |
Demographics Similar to Immigrants from South Africa by In Labor Force | Age 25-29
In terms of in labor force | age 25-29, the demographic groups most similar to Immigrants from South Africa are Immigrants from Chile (84.9%, a difference of 0.010%), Scandinavian (84.9%, a difference of 0.010%), Filipino (84.9%, a difference of 0.020%), Dutch (84.9%, a difference of 0.020%), and Immigrants from Iran (84.9%, a difference of 0.020%).
| Demographics | Rating | Rank | In Labor Force | Age 25-29 |
| Irish | 90.6 /100 | #113 | Exceptional 85.0% |
| Immigrants | Malaysia | 90.4 /100 | #114 | Exceptional 85.0% |
| South Africans | 88.9 /100 | #115 | Excellent 85.0% |
| Chileans | 88.8 /100 | #116 | Excellent 85.0% |
| Immigrants | Belarus | 88.0 /100 | #117 | Excellent 85.0% |
| Finns | 87.8 /100 | #118 | Excellent 85.0% |
| Filipinos | 87.1 /100 | #119 | Excellent 84.9% |
| Immigrants | South Africa | 86.1 /100 | #120 | Excellent 84.9% |
| Immigrants | Chile | 85.6 /100 | #121 | Excellent 84.9% |
| Scandinavians | 85.1 /100 | #122 | Excellent 84.9% |
| Dutch | 84.9 /100 | #123 | Excellent 84.9% |
| Immigrants | Iran | 84.8 /100 | #124 | Excellent 84.9% |
| Uruguayans | 84.7 /100 | #125 | Excellent 84.9% |
| Immigrants | Singapore | 84.4 /100 | #126 | Excellent 84.9% |
| Immigrants | Uruguay | 84.0 /100 | #127 | Excellent 84.9% |