Immigrants from Norway vs Immigrants Divorced or Separated
COMPARE
Immigrants from Norway
Immigrants
Divorced or Separated
Divorced or Separated Comparison
Immigrants from Norway
Immigrants
11.7%
DIVORCED OR SEPARATED
95.9/ 100
METRIC RATING
114th/ 347
METRIC RANK
11.8%
DIVORCED OR SEPARATED
93.7/ 100
METRIC RATING
123rd/ 347
METRIC RANK
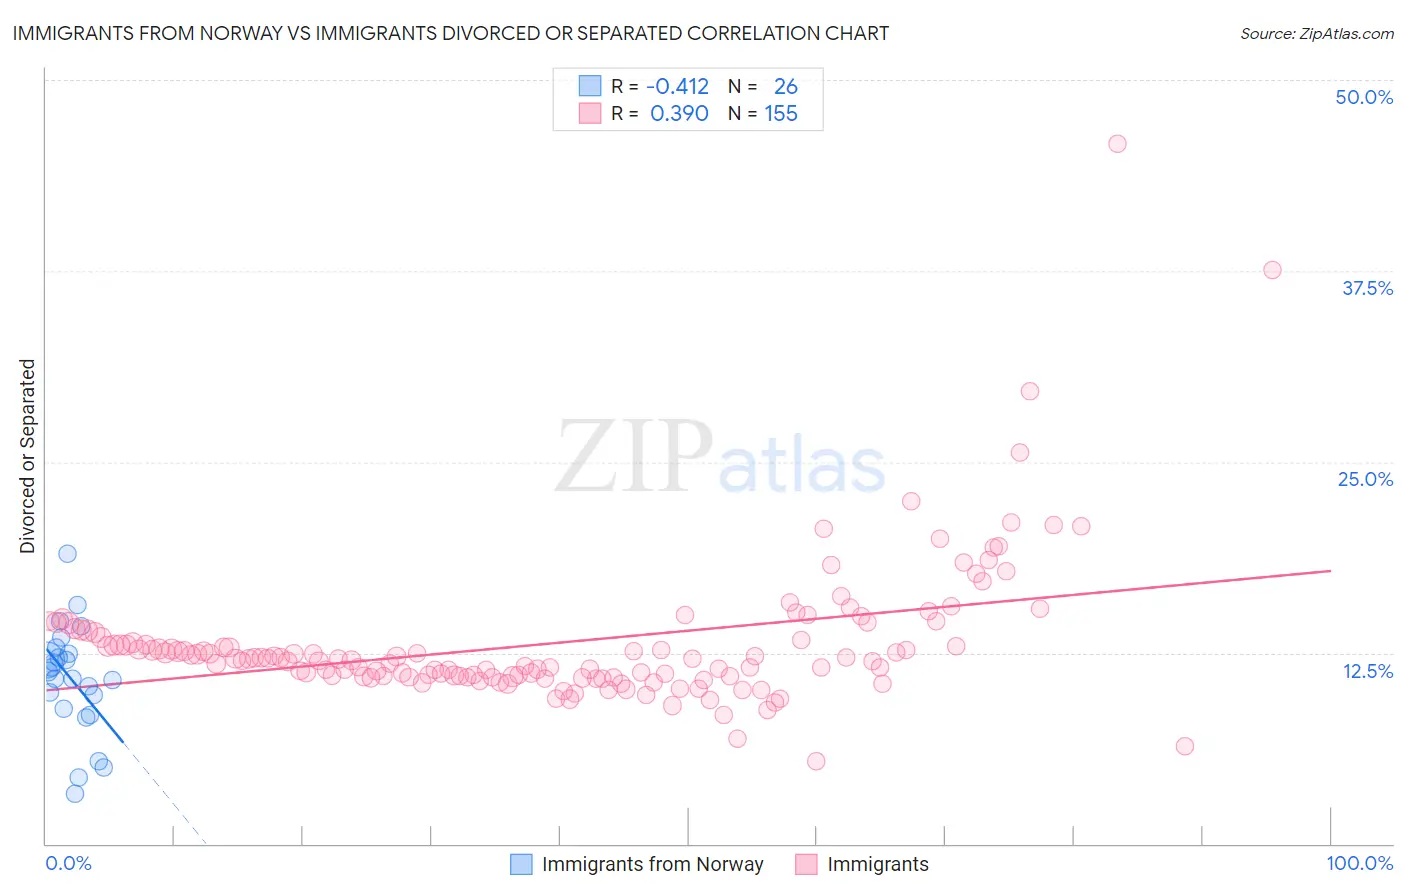
Immigrants from Norway vs Immigrants Divorced or Separated Correlation Chart
The statistical analysis conducted on geographies consisting of 116,710,003 people shows a moderate negative correlation between the proportion of Immigrants from Norway and percentage of population currently divorced or separated in the United States with a correlation coefficient (R) of -0.412 and weighted average of 11.7%. Similarly, the statistical analysis conducted on geographies consisting of 577,228,923 people shows a mild positive correlation between the proportion of Immigrants and percentage of population currently divorced or separated in the United States with a correlation coefficient (R) of 0.390 and weighted average of 11.8%, a difference of 0.42%.
Divorced or Separated Correlation Summary
| Measurement | Immigrants from Norway | Immigrants |
| Minimum | 3.3% | 5.4% |
| Maximum | 18.9% | 45.8% |
| Range | 15.6% | 40.4% |
| Mean | 10.7% | 13.1% |
| Median | 11.0% | 12.1% |
| Interquartile 25% (IQ1) | 8.8% | 10.9% |
| Interquartile 75% (IQ3) | 12.5% | 13.5% |
| Interquartile Range (IQR) | 3.6% | 2.6% |
| Standard Deviation (Sample) | 3.6% | 4.7% |
| Standard Deviation (Population) | 3.5% | 4.7% |
Demographics Similar to Immigrants from Norway and Immigrants by Divorced or Separated
In terms of divorced or separated, the demographic groups most similar to Immigrants from Norway are Lithuanian (11.7%, a difference of 0.050%), Immigrants from Iraq (11.7%, a difference of 0.12%), Immigrants from Uganda (11.7%, a difference of 0.13%), Ecuadorian (11.7%, a difference of 0.14%), and Immigrants from France (11.7%, a difference of 0.17%). Similarly, the demographic groups most similar to Immigrants are Menominee (11.8%, a difference of 0.020%), Ugandan (11.8%, a difference of 0.080%), Romanian (11.8%, a difference of 0.13%), Iraqi (11.8%, a difference of 0.15%), and Ukrainian (11.8%, a difference of 0.19%).
| Demographics | Rating | Rank | Divorced or Separated |
| Greeks | 96.9 /100 | #108 | Exceptional 11.7% |
| Immigrants | South Africa | 96.9 /100 | #109 | Exceptional 11.7% |
| Immigrants | Czechoslovakia | 96.9 /100 | #110 | Exceptional 11.7% |
| Immigrants | Spain | 96.8 /100 | #111 | Exceptional 11.7% |
| Immigrants | France | 96.6 /100 | #112 | Exceptional 11.7% |
| Estonians | 96.6 /100 | #113 | Exceptional 11.7% |
| Immigrants | Norway | 95.9 /100 | #114 | Exceptional 11.7% |
| Lithuanians | 95.7 /100 | #115 | Exceptional 11.7% |
| Immigrants | Iraq | 95.4 /100 | #116 | Exceptional 11.7% |
| Immigrants | Uganda | 95.3 /100 | #117 | Exceptional 11.7% |
| Ecuadorians | 95.3 /100 | #118 | Exceptional 11.7% |
| Syrians | 95.1 /100 | #119 | Exceptional 11.7% |
| Iraqis | 94.6 /100 | #120 | Exceptional 11.8% |
| Romanians | 94.5 /100 | #121 | Exceptional 11.8% |
| Menominee | 93.8 /100 | #122 | Exceptional 11.8% |
| Immigrants | Immigrants | 93.7 /100 | #123 | Exceptional 11.8% |
| Ugandans | 93.1 /100 | #124 | Exceptional 11.8% |
| Ukrainians | 92.3 /100 | #125 | Exceptional 11.8% |
| South American Indians | 92.1 /100 | #126 | Exceptional 11.8% |
| South Africans | 88.9 /100 | #127 | Excellent 11.8% |
| Immigrants | Ecuador | 88.9 /100 | #128 | Excellent 11.8% |