Immigrants from Belize vs Immigrants from Romania In Labor Force | Age 16-19
COMPARE
Immigrants from Belize
Immigrants from Romania
In Labor Force | Age 16-19
In Labor Force | Age 16-19 Comparison
Immigrants from Belize
Immigrants from Romania
31.8%
IN LABOR FORCE | AGE 16-19
0.0/ 100
METRIC RATING
312th/ 347
METRIC RANK
36.3%
IN LABOR FORCE | AGE 16-19
34.0/ 100
METRIC RATING
186th/ 347
METRIC RANK
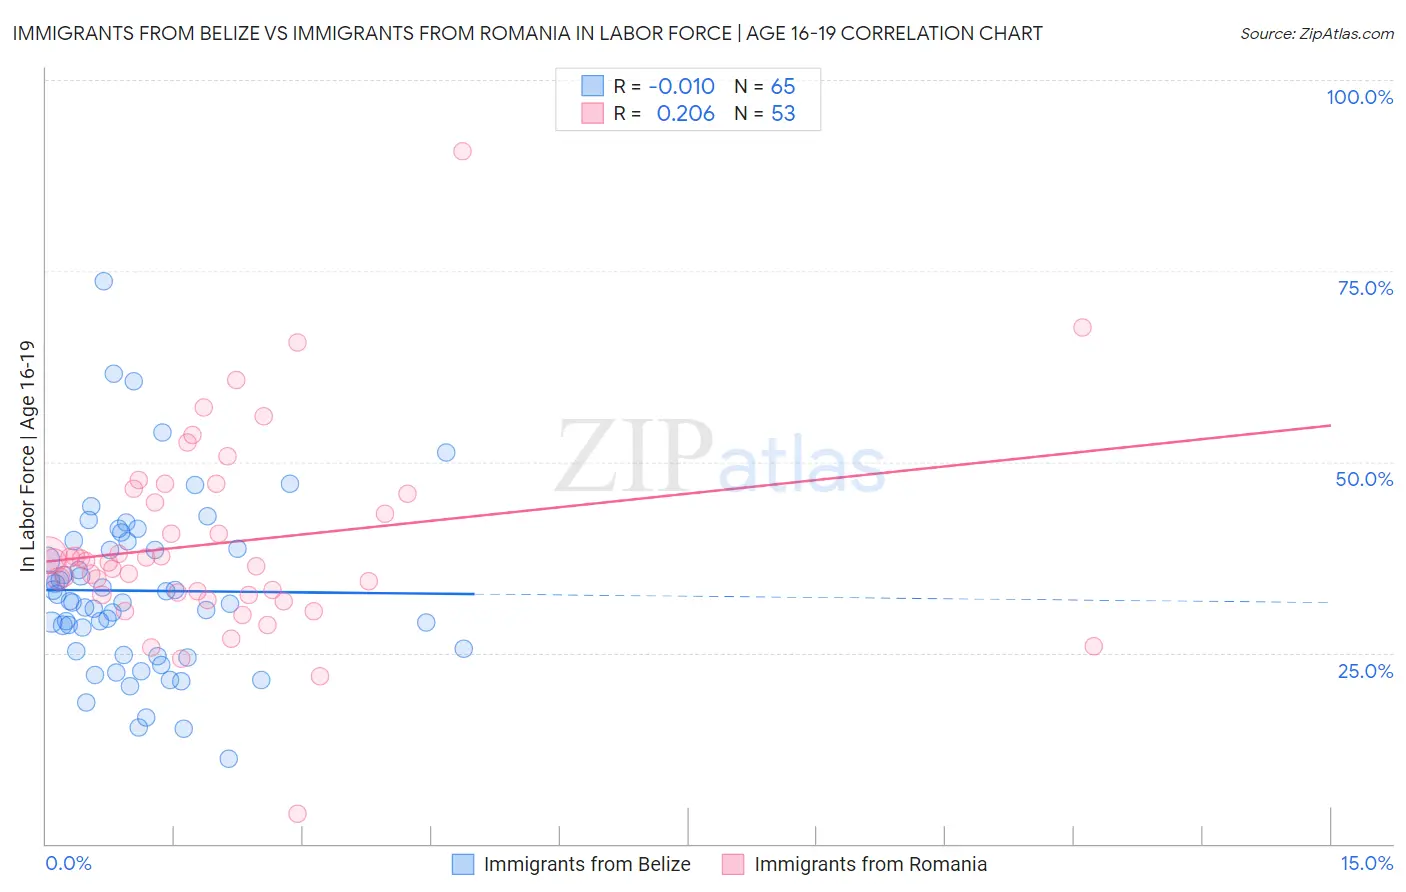
Immigrants from Belize vs Immigrants from Romania In Labor Force | Age 16-19 Correlation Chart
The statistical analysis conducted on geographies consisting of 130,258,278 people shows no correlation between the proportion of Immigrants from Belize and labor force participation rate among population between the ages 16 and 19 in the United States with a correlation coefficient (R) of -0.010 and weighted average of 31.8%. Similarly, the statistical analysis conducted on geographies consisting of 256,696,852 people shows a weak positive correlation between the proportion of Immigrants from Romania and labor force participation rate among population between the ages 16 and 19 in the United States with a correlation coefficient (R) of 0.206 and weighted average of 36.3%, a difference of 14.0%.
In Labor Force | Age 16-19 Correlation Summary
| Measurement | Immigrants from Belize | Immigrants from Romania |
| Minimum | 11.1% | 3.9% |
| Maximum | 73.6% | 90.6% |
| Range | 62.5% | 86.7% |
| Mean | 33.1% | 39.4% |
| Median | 31.6% | 37.0% |
| Interquartile 25% (IQ1) | 25.0% | 32.6% |
| Interquartile 75% (IQ3) | 39.1% | 46.1% |
| Interquartile Range (IQR) | 14.1% | 13.6% |
| Standard Deviation (Sample) | 11.4% | 13.3% |
| Standard Deviation (Population) | 11.3% | 13.2% |
Similar Demographics by In Labor Force | Age 16-19
Demographics Similar to Immigrants from Belize by In Labor Force | Age 16-19
In terms of in labor force | age 16-19, the demographic groups most similar to Immigrants from Belize are Hopi (31.8%, a difference of 0.010%), Indian (Asian) (31.9%, a difference of 0.14%), Cuban (31.8%, a difference of 0.16%), Immigrants from West Indies (31.7%, a difference of 0.34%), and Filipino (31.7%, a difference of 0.43%).
| Demographics | Rating | Rank | In Labor Force | Age 16-19 |
| Nicaraguans | 0.0 /100 | #305 | Tragic 32.4% |
| Spanish American Indians | 0.0 /100 | #306 | Tragic 32.4% |
| Immigrants | Jamaica | 0.0 /100 | #307 | Tragic 32.2% |
| Navajo | 0.0 /100 | #308 | Tragic 32.1% |
| Immigrants | Eastern Asia | 0.0 /100 | #309 | Tragic 32.0% |
| Immigrants | Iran | 0.0 /100 | #310 | Tragic 32.0% |
| Indians (Asian) | 0.0 /100 | #311 | Tragic 31.9% |
| Immigrants | Belize | 0.0 /100 | #312 | Tragic 31.8% |
| Hopi | 0.0 /100 | #313 | Tragic 31.8% |
| Cubans | 0.0 /100 | #314 | Tragic 31.8% |
| Immigrants | West Indies | 0.0 /100 | #315 | Tragic 31.7% |
| Filipinos | 0.0 /100 | #316 | Tragic 31.7% |
| Immigrants | Nicaragua | 0.0 /100 | #317 | Tragic 31.6% |
| Immigrants | Yemen | 0.0 /100 | #318 | Tragic 31.5% |
| Soviet Union | 0.0 /100 | #319 | Tragic 31.4% |
Demographics Similar to Immigrants from Romania by In Labor Force | Age 16-19
In terms of in labor force | age 16-19, the demographic groups most similar to Immigrants from Romania are Immigrants from Afghanistan (36.3%, a difference of 0.0%), Bhutanese (36.3%, a difference of 0.070%), Costa Rican (36.3%, a difference of 0.12%), Immigrants from Europe (36.2%, a difference of 0.13%), and Eastern European (36.4%, a difference of 0.27%).
| Demographics | Rating | Rank | In Labor Force | Age 16-19 |
| Immigrants | Southern Europe | 43.3 /100 | #179 | Average 36.4% |
| Immigrants | Morocco | 41.1 /100 | #180 | Average 36.4% |
| Jordanians | 39.6 /100 | #181 | Fair 36.4% |
| Immigrants | Italy | 39.1 /100 | #182 | Fair 36.4% |
| Eastern Europeans | 38.8 /100 | #183 | Fair 36.4% |
| Costa Ricans | 36.1 /100 | #184 | Fair 36.3% |
| Bhutanese | 35.3 /100 | #185 | Fair 36.3% |
| Immigrants | Romania | 34.0 /100 | #186 | Fair 36.3% |
| Immigrants | Afghanistan | 34.0 /100 | #187 | Fair 36.3% |
| Immigrants | Europe | 31.8 /100 | #188 | Fair 36.2% |
| Immigrants | Hungary | 28.8 /100 | #189 | Fair 36.2% |
| Panamanians | 28.6 /100 | #190 | Fair 36.1% |
| Immigrants | Croatia | 27.5 /100 | #191 | Fair 36.1% |
| Afghans | 25.7 /100 | #192 | Fair 36.1% |
| Immigrants | Denmark | 25.0 /100 | #193 | Fair 36.1% |