Immigrants from Kuwait vs Immigrants from Romania In Labor Force | Age 16-19
COMPARE
Immigrants from Kuwait
Immigrants from Romania
In Labor Force | Age 16-19
In Labor Force | Age 16-19 Comparison
Immigrants from Kuwait
Immigrants from Romania
36.9%
IN LABOR FORCE | AGE 16-19
68.9/ 100
METRIC RATING
164th/ 347
METRIC RANK
36.3%
IN LABOR FORCE | AGE 16-19
34.0/ 100
METRIC RATING
186th/ 347
METRIC RANK
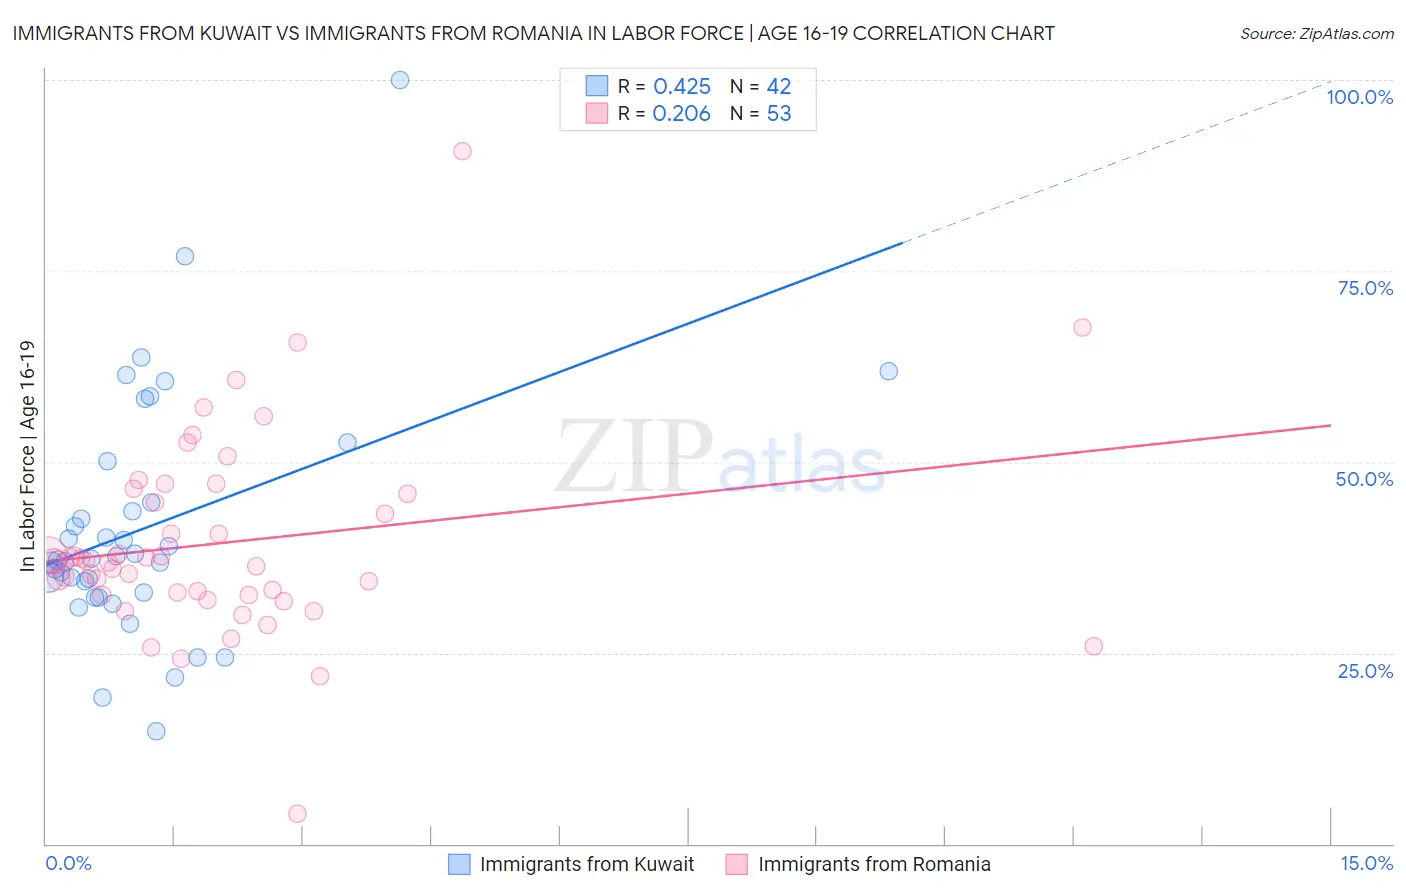
Immigrants from Kuwait vs Immigrants from Romania In Labor Force | Age 16-19 Correlation Chart
The statistical analysis conducted on geographies consisting of 136,896,813 people shows a moderate positive correlation between the proportion of Immigrants from Kuwait and labor force participation rate among population between the ages 16 and 19 in the United States with a correlation coefficient (R) of 0.425 and weighted average of 36.9%. Similarly, the statistical analysis conducted on geographies consisting of 256,696,852 people shows a weak positive correlation between the proportion of Immigrants from Romania and labor force participation rate among population between the ages 16 and 19 in the United States with a correlation coefficient (R) of 0.206 and weighted average of 36.3%, a difference of 1.8%.
In Labor Force | Age 16-19 Correlation Summary
| Measurement | Immigrants from Kuwait | Immigrants from Romania |
| Minimum | 14.8% | 3.9% |
| Maximum | 100.0% | 90.6% |
| Range | 85.2% | 86.7% |
| Mean | 41.4% | 39.4% |
| Median | 37.2% | 37.0% |
| Interquartile 25% (IQ1) | 32.9% | 32.6% |
| Interquartile 75% (IQ3) | 44.7% | 46.1% |
| Interquartile Range (IQR) | 11.8% | 13.6% |
| Standard Deviation (Sample) | 15.9% | 13.3% |
| Standard Deviation (Population) | 15.7% | 13.2% |
Similar Demographics by In Labor Force | Age 16-19
Demographics Similar to Immigrants from Kuwait by In Labor Force | Age 16-19
In terms of in labor force | age 16-19, the demographic groups most similar to Immigrants from Kuwait are Bermudan (36.9%, a difference of 0.020%), Immigrants from Jordan (36.9%, a difference of 0.040%), Yakama (36.9%, a difference of 0.11%), Immigrants from Western Africa (36.9%, a difference of 0.12%), and Cambodian (37.0%, a difference of 0.16%).
| Demographics | Rating | Rank | In Labor Force | Age 16-19 |
| Immigrants | Brazil | 76.5 /100 | #157 | Good 37.1% |
| Ute | 75.7 /100 | #158 | Good 37.1% |
| Yaqui | 74.4 /100 | #159 | Good 37.1% |
| Immigrants | Saudi Arabia | 73.9 /100 | #160 | Good 37.0% |
| Cambodians | 71.5 /100 | #161 | Good 37.0% |
| Immigrants | Jordan | 69.5 /100 | #162 | Good 36.9% |
| Bermudans | 69.3 /100 | #163 | Good 36.9% |
| Immigrants | Kuwait | 68.9 /100 | #164 | Good 36.9% |
| Yakama | 66.9 /100 | #165 | Good 36.9% |
| Immigrants | Western Africa | 66.7 /100 | #166 | Good 36.9% |
| Arabs | 63.6 /100 | #167 | Good 36.8% |
| Palestinians | 63.1 /100 | #168 | Good 36.8% |
| Immigrants | Latvia | 61.6 /100 | #169 | Good 36.8% |
| Immigrants | South Africa | 60.5 /100 | #170 | Good 36.8% |
| Immigrants | Cambodia | 58.4 /100 | #171 | Average 36.7% |
Demographics Similar to Immigrants from Romania by In Labor Force | Age 16-19
In terms of in labor force | age 16-19, the demographic groups most similar to Immigrants from Romania are Immigrants from Afghanistan (36.3%, a difference of 0.0%), Bhutanese (36.3%, a difference of 0.070%), Costa Rican (36.3%, a difference of 0.12%), Immigrants from Europe (36.2%, a difference of 0.13%), and Eastern European (36.4%, a difference of 0.27%).
| Demographics | Rating | Rank | In Labor Force | Age 16-19 |
| Immigrants | Southern Europe | 43.3 /100 | #179 | Average 36.4% |
| Immigrants | Morocco | 41.1 /100 | #180 | Average 36.4% |
| Jordanians | 39.6 /100 | #181 | Fair 36.4% |
| Immigrants | Italy | 39.1 /100 | #182 | Fair 36.4% |
| Eastern Europeans | 38.8 /100 | #183 | Fair 36.4% |
| Costa Ricans | 36.1 /100 | #184 | Fair 36.3% |
| Bhutanese | 35.3 /100 | #185 | Fair 36.3% |
| Immigrants | Romania | 34.0 /100 | #186 | Fair 36.3% |
| Immigrants | Afghanistan | 34.0 /100 | #187 | Fair 36.3% |
| Immigrants | Europe | 31.8 /100 | #188 | Fair 36.2% |
| Immigrants | Hungary | 28.8 /100 | #189 | Fair 36.2% |
| Panamanians | 28.6 /100 | #190 | Fair 36.1% |
| Immigrants | Croatia | 27.5 /100 | #191 | Fair 36.1% |
| Afghans | 25.7 /100 | #192 | Fair 36.1% |
| Immigrants | Denmark | 25.0 /100 | #193 | Fair 36.1% |