Immigrants from Northern Europe vs Immigrants from Netherlands In Labor Force | Age 20-24
COMPARE
Immigrants from Northern Europe
Immigrants from Netherlands
In Labor Force | Age 20-24
In Labor Force | Age 20-24 Comparison
Immigrants from Northern Europe
Immigrants from Netherlands
74.8%
IN LABOR FORCE | AGE 20-24
32.6/ 100
METRIC RATING
189th/ 347
METRIC RANK
75.9%
IN LABOR FORCE | AGE 20-24
95.3/ 100
METRIC RATING
113th/ 347
METRIC RANK
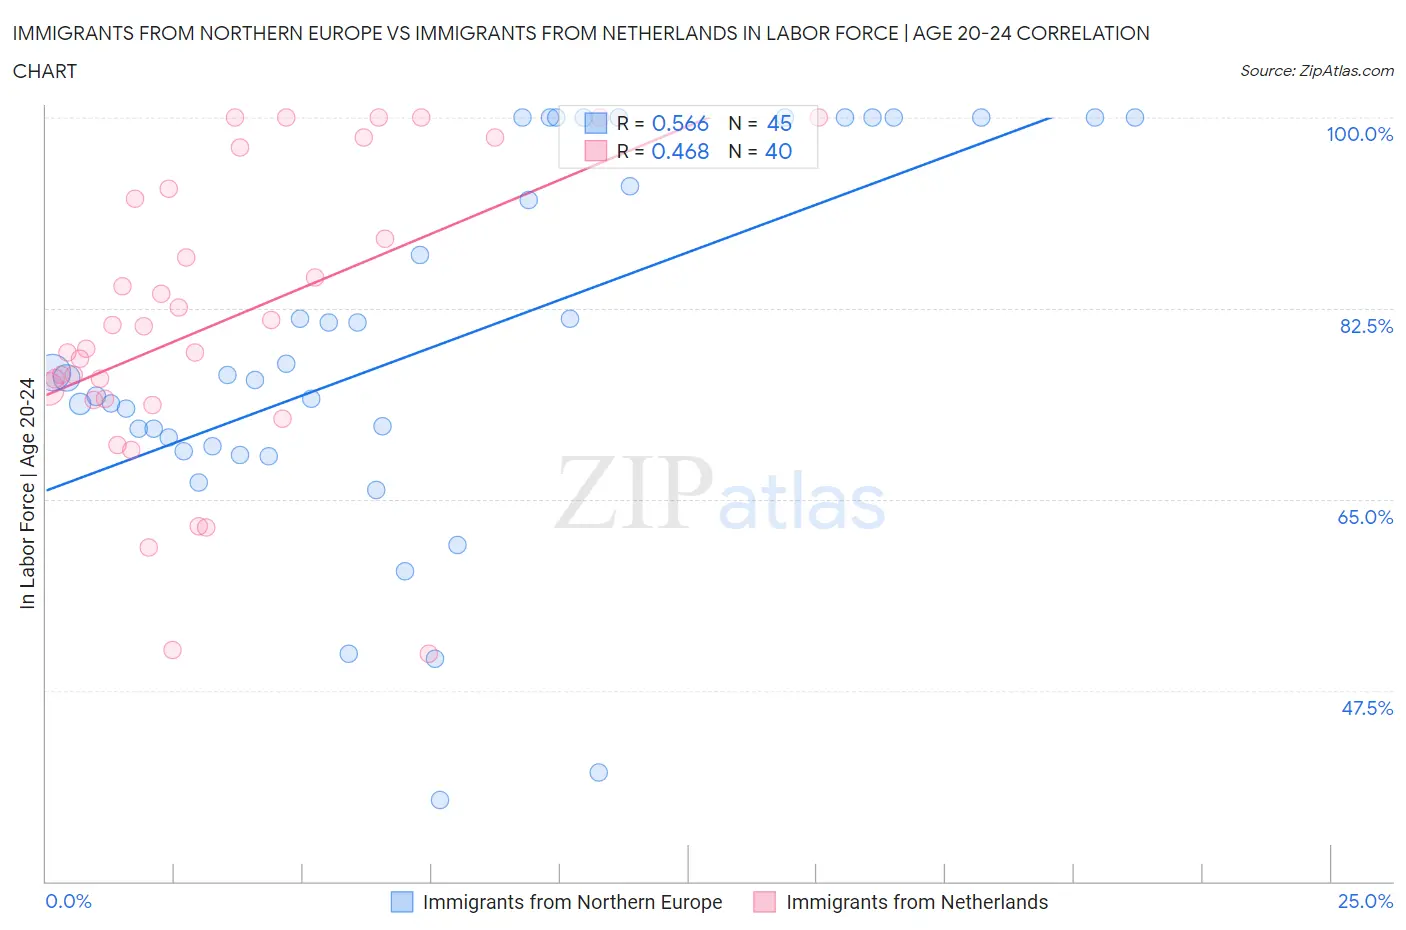
Immigrants from Northern Europe vs Immigrants from Netherlands In Labor Force | Age 20-24 Correlation Chart
The statistical analysis conducted on geographies consisting of 476,778,788 people shows a substantial positive correlation between the proportion of Immigrants from Northern Europe and labor force participation rate among population between the ages 20 and 24 in the United States with a correlation coefficient (R) of 0.566 and weighted average of 74.8%. Similarly, the statistical analysis conducted on geographies consisting of 237,756,787 people shows a moderate positive correlation between the proportion of Immigrants from Netherlands and labor force participation rate among population between the ages 20 and 24 in the United States with a correlation coefficient (R) of 0.468 and weighted average of 75.9%, a difference of 1.4%.
In Labor Force | Age 20-24 Correlation Summary
| Measurement | Immigrants from Northern Europe | Immigrants from Netherlands |
| Minimum | 37.5% | 50.8% |
| Maximum | 100.0% | 100.0% |
| Range | 62.5% | 49.2% |
| Mean | 78.8% | 81.3% |
| Median | 76.1% | 79.8% |
| Interquartile 25% (IQ1) | 69.6% | 74.2% |
| Interquartile 75% (IQ3) | 100.0% | 93.0% |
| Interquartile Range (IQR) | 30.4% | 18.9% |
| Standard Deviation (Sample) | 16.9% | 13.4% |
| Standard Deviation (Population) | 16.7% | 13.2% |
Similar Demographics by In Labor Force | Age 20-24
Demographics Similar to Immigrants from Northern Europe by In Labor Force | Age 20-24
In terms of in labor force | age 20-24, the demographic groups most similar to Immigrants from Northern Europe are Honduran (74.8%, a difference of 0.0%), Immigrants from Honduras (74.9%, a difference of 0.010%), Russian (74.8%, a difference of 0.010%), Immigrants from Eastern Europe (74.9%, a difference of 0.020%), and Immigrants from Hungary (74.9%, a difference of 0.040%).
| Demographics | Rating | Rank | In Labor Force | Age 20-24 |
| Immigrants | South Africa | 36.9 /100 | #182 | Fair 74.9% |
| Immigrants | Costa Rica | 36.7 /100 | #183 | Fair 74.9% |
| Immigrants | Hungary | 35.0 /100 | #184 | Fair 74.9% |
| Sri Lankans | 34.9 /100 | #185 | Fair 74.9% |
| Immigrants | Eastern Europe | 33.8 /100 | #186 | Fair 74.9% |
| Immigrants | Honduras | 33.5 /100 | #187 | Fair 74.9% |
| Hondurans | 32.7 /100 | #188 | Fair 74.8% |
| Immigrants | Northern Europe | 32.6 /100 | #189 | Fair 74.8% |
| Russians | 32.2 /100 | #190 | Fair 74.8% |
| Senegalese | 28.1 /100 | #191 | Fair 74.8% |
| Immigrants | Europe | 27.5 /100 | #192 | Fair 74.8% |
| Alsatians | 27.1 /100 | #193 | Fair 74.8% |
| Immigrants | Denmark | 25.8 /100 | #194 | Fair 74.8% |
| Eastern Europeans | 25.4 /100 | #195 | Fair 74.8% |
| Immigrants | Vietnam | 25.1 /100 | #196 | Fair 74.7% |
Demographics Similar to Immigrants from Netherlands by In Labor Force | Age 20-24
In terms of in labor force | age 20-24, the demographic groups most similar to Immigrants from Netherlands are Immigrants from Zimbabwe (75.9%, a difference of 0.010%), Alaska Native (75.9%, a difference of 0.010%), Immigrants from North America (75.9%, a difference of 0.020%), Immigrants from Canada (75.9%, a difference of 0.030%), and Assyrian/Chaldean/Syriac (75.9%, a difference of 0.030%).
| Demographics | Rating | Rank | In Labor Force | Age 20-24 |
| Immigrants | Uganda | 97.1 /100 | #106 | Exceptional 76.0% |
| Greeks | 96.9 /100 | #107 | Exceptional 76.0% |
| Iraqis | 96.6 /100 | #108 | Exceptional 76.0% |
| Cherokee | 95.8 /100 | #109 | Exceptional 75.9% |
| Immigrants | Morocco | 95.8 /100 | #110 | Exceptional 75.9% |
| Ukrainians | 95.7 /100 | #111 | Exceptional 75.9% |
| Immigrants | Canada | 95.6 /100 | #112 | Exceptional 75.9% |
| Immigrants | Netherlands | 95.3 /100 | #113 | Exceptional 75.9% |
| Immigrants | Zimbabwe | 95.1 /100 | #114 | Exceptional 75.9% |
| Alaska Natives | 95.1 /100 | #115 | Exceptional 75.9% |
| Immigrants | North America | 95.0 /100 | #116 | Exceptional 75.9% |
| Assyrians/Chaldeans/Syriacs | 94.9 /100 | #117 | Exceptional 75.9% |
| Spanish Americans | 94.8 /100 | #118 | Exceptional 75.8% |
| Immigrants | Portugal | 94.8 /100 | #119 | Exceptional 75.8% |
| Immigrants | Africa | 94.6 /100 | #120 | Exceptional 75.8% |