Immigrants from North Macedonia vs Swedish In Labor Force | Age 20-64
COMPARE
Immigrants from North Macedonia
Swedish
In Labor Force | Age 20-64
In Labor Force | Age 20-64 Comparison
Immigrants from North Macedonia
Swedes
80.7%
IN LABOR FORCE | AGE 20-64
99.9/ 100
METRIC RATING
30th/ 347
METRIC RANK
80.3%
IN LABOR FORCE | AGE 20-64
98.9/ 100
METRIC RATING
59th/ 347
METRIC RANK
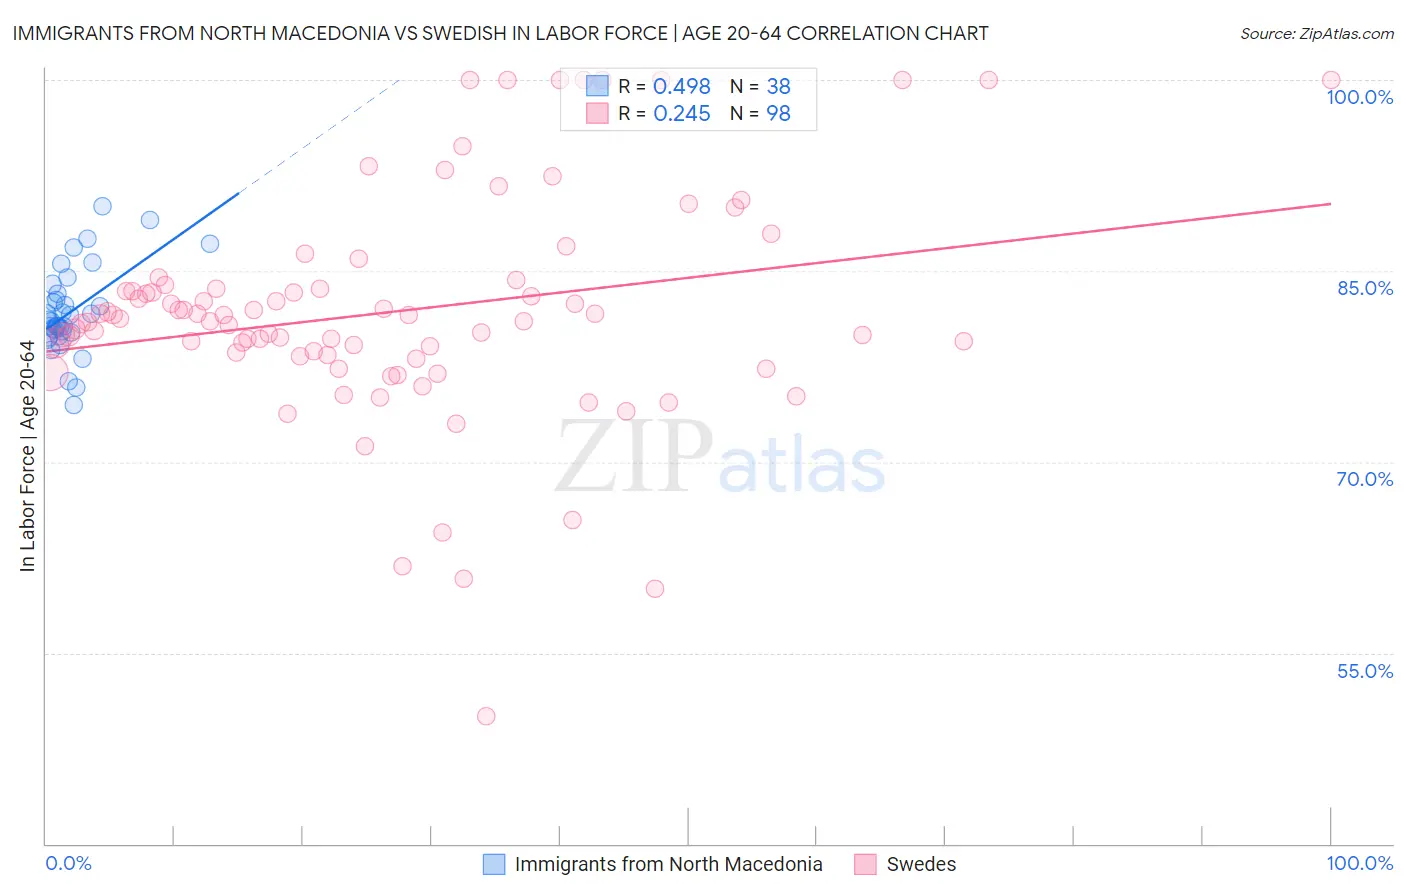
Immigrants from North Macedonia vs Swedish In Labor Force | Age 20-64 Correlation Chart
The statistical analysis conducted on geographies consisting of 74,317,186 people shows a moderate positive correlation between the proportion of Immigrants from North Macedonia and labor force participation rate among population between the ages 20 and 64 in the United States with a correlation coefficient (R) of 0.498 and weighted average of 80.7%. Similarly, the statistical analysis conducted on geographies consisting of 539,244,386 people shows a weak positive correlation between the proportion of Swedes and labor force participation rate among population between the ages 20 and 64 in the United States with a correlation coefficient (R) of 0.245 and weighted average of 80.3%, a difference of 0.56%.
In Labor Force | Age 20-64 Correlation Summary
| Measurement | Immigrants from North Macedonia | Swedish |
| Minimum | 74.4% | 50.0% |
| Maximum | 90.1% | 100.0% |
| Range | 15.7% | 50.0% |
| Mean | 81.8% | 81.8% |
| Median | 81.1% | 81.2% |
| Interquartile 25% (IQ1) | 80.1% | 78.4% |
| Interquartile 75% (IQ3) | 83.2% | 83.6% |
| Interquartile Range (IQR) | 3.1% | 5.2% |
| Standard Deviation (Sample) | 3.4% | 8.9% |
| Standard Deviation (Population) | 3.4% | 8.9% |
Similar Demographics by In Labor Force | Age 20-64
Demographics Similar to Immigrants from North Macedonia by In Labor Force | Age 20-64
In terms of in labor force | age 20-64, the demographic groups most similar to Immigrants from North Macedonia are Immigrants from South Central Asia (80.7%, a difference of 0.010%), Immigrants from Uganda (80.7%, a difference of 0.020%), Immigrants from Lithuania (80.7%, a difference of 0.020%), Immigrants from Kenya (80.7%, a difference of 0.030%), and Immigrants from Ireland (80.7%, a difference of 0.030%).
| Demographics | Rating | Rank | In Labor Force | Age 20-64 |
| Immigrants | Bosnia and Herzegovina | 100.0 /100 | #23 | Exceptional 80.8% |
| Immigrants | Morocco | 100.0 /100 | #24 | Exceptional 80.8% |
| Kenyans | 100.0 /100 | #25 | Exceptional 80.8% |
| Immigrants | Serbia | 100.0 /100 | #26 | Exceptional 80.8% |
| Immigrants | Kenya | 99.9 /100 | #27 | Exceptional 80.7% |
| Immigrants | Uganda | 99.9 /100 | #28 | Exceptional 80.7% |
| Immigrants | South Central Asia | 99.9 /100 | #29 | Exceptional 80.7% |
| Immigrants | North Macedonia | 99.9 /100 | #30 | Exceptional 80.7% |
| Immigrants | Lithuania | 99.9 /100 | #31 | Exceptional 80.7% |
| Immigrants | Ireland | 99.9 /100 | #32 | Exceptional 80.7% |
| Chinese | 99.9 /100 | #33 | Exceptional 80.7% |
| Immigrants | Brazil | 99.9 /100 | #34 | Exceptional 80.7% |
| Immigrants | Poland | 99.9 /100 | #35 | Exceptional 80.6% |
| Paraguayans | 99.8 /100 | #36 | Exceptional 80.6% |
| Immigrants | Moldova | 99.8 /100 | #37 | Exceptional 80.6% |
Demographics Similar to Swedes by In Labor Force | Age 20-64
In terms of in labor force | age 20-64, the demographic groups most similar to Swedes are Serbian (80.3%, a difference of 0.0%), Tongan (80.3%, a difference of 0.0%), Afghan (80.3%, a difference of 0.010%), Burmese (80.3%, a difference of 0.010%), and Carpatho Rusyn (80.3%, a difference of 0.010%).
| Demographics | Rating | Rank | In Labor Force | Age 20-64 |
| Turks | 99.2 /100 | #52 | Exceptional 80.3% |
| Immigrants | Peru | 99.2 /100 | #53 | Exceptional 80.3% |
| Peruvians | 99.1 /100 | #54 | Exceptional 80.3% |
| Immigrants | Cabo Verde | 99.0 /100 | #55 | Exceptional 80.3% |
| Immigrants | Northern Africa | 99.0 /100 | #56 | Exceptional 80.3% |
| Afghans | 98.9 /100 | #57 | Exceptional 80.3% |
| Serbians | 98.9 /100 | #58 | Exceptional 80.3% |
| Swedes | 98.9 /100 | #59 | Exceptional 80.3% |
| Tongans | 98.8 /100 | #60 | Exceptional 80.3% |
| Burmese | 98.8 /100 | #61 | Exceptional 80.3% |
| Carpatho Rusyns | 98.8 /100 | #62 | Exceptional 80.3% |
| Immigrants | Korea | 98.8 /100 | #63 | Exceptional 80.3% |
| Immigrants | Albania | 98.7 /100 | #64 | Exceptional 80.3% |
| Lithuanians | 98.7 /100 | #65 | Exceptional 80.2% |
| Macedonians | 98.7 /100 | #66 | Exceptional 80.2% |