Immigrants from North Macedonia vs European In Labor Force | Age 20-64
COMPARE
Immigrants from North Macedonia
European
In Labor Force | Age 20-64
In Labor Force | Age 20-64 Comparison
Immigrants from North Macedonia
Europeans
80.7%
IN LABOR FORCE | AGE 20-64
99.9/ 100
METRIC RATING
30th/ 347
METRIC RANK
79.3%
IN LABOR FORCE | AGE 20-64
15.3/ 100
METRIC RATING
211th/ 347
METRIC RANK
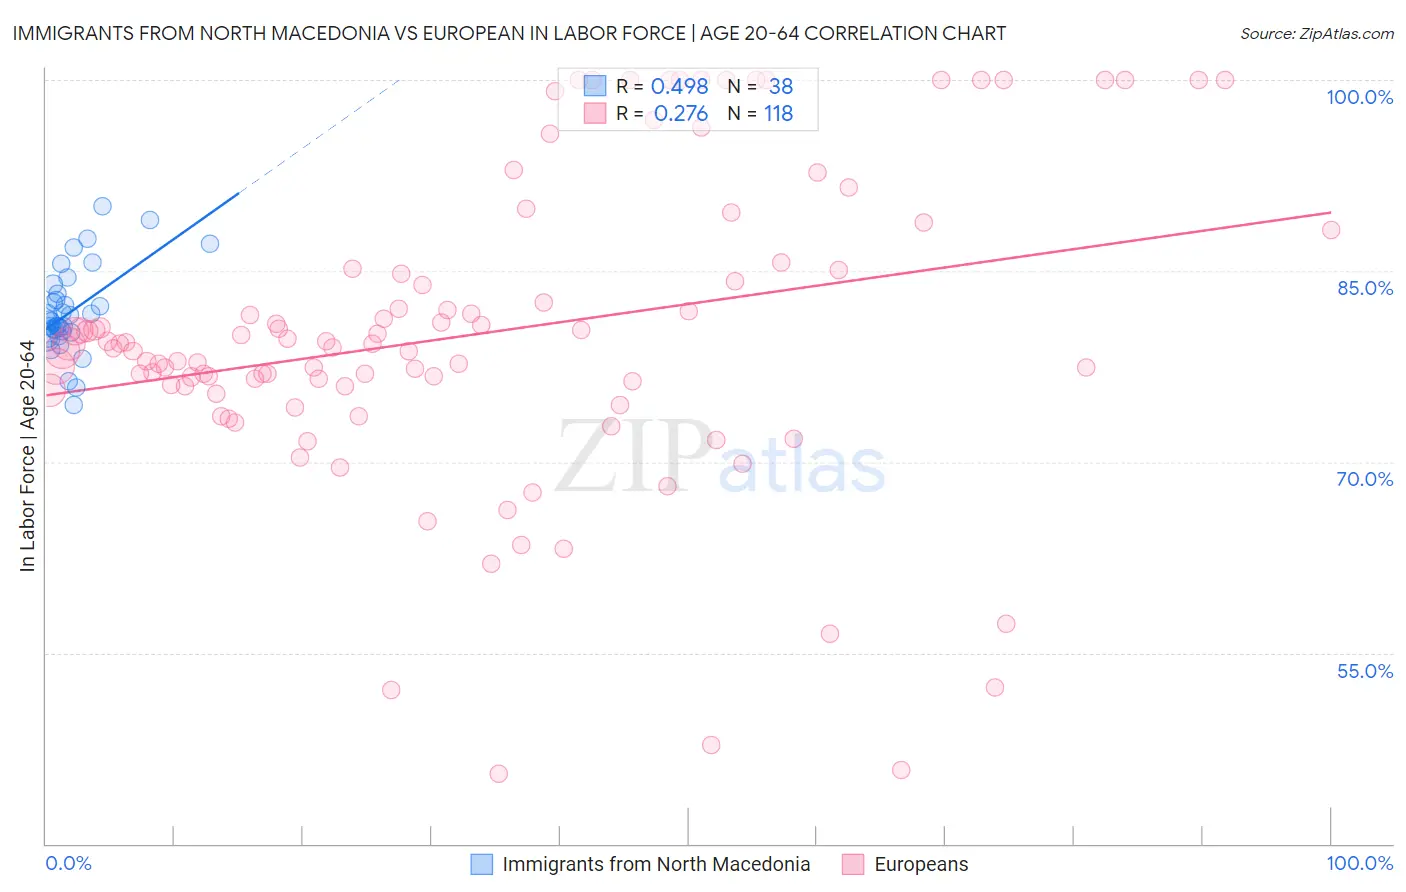
Immigrants from North Macedonia vs European In Labor Force | Age 20-64 Correlation Chart
The statistical analysis conducted on geographies consisting of 74,317,186 people shows a moderate positive correlation between the proportion of Immigrants from North Macedonia and labor force participation rate among population between the ages 20 and 64 in the United States with a correlation coefficient (R) of 0.498 and weighted average of 80.7%. Similarly, the statistical analysis conducted on geographies consisting of 561,836,944 people shows a weak positive correlation between the proportion of Europeans and labor force participation rate among population between the ages 20 and 64 in the United States with a correlation coefficient (R) of 0.276 and weighted average of 79.3%, a difference of 1.8%.
In Labor Force | Age 20-64 Correlation Summary
| Measurement | Immigrants from North Macedonia | European |
| Minimum | 74.4% | 45.5% |
| Maximum | 90.1% | 100.0% |
| Range | 15.7% | 54.5% |
| Mean | 81.8% | 80.1% |
| Median | 81.1% | 79.1% |
| Interquartile 25% (IQ1) | 80.1% | 76.0% |
| Interquartile 75% (IQ3) | 83.2% | 85.1% |
| Interquartile Range (IQR) | 3.1% | 9.1% |
| Standard Deviation (Sample) | 3.4% | 12.1% |
| Standard Deviation (Population) | 3.4% | 12.1% |
Similar Demographics by In Labor Force | Age 20-64
Demographics Similar to Immigrants from North Macedonia by In Labor Force | Age 20-64
In terms of in labor force | age 20-64, the demographic groups most similar to Immigrants from North Macedonia are Immigrants from South Central Asia (80.7%, a difference of 0.010%), Immigrants from Uganda (80.7%, a difference of 0.020%), Immigrants from Lithuania (80.7%, a difference of 0.020%), Immigrants from Kenya (80.7%, a difference of 0.030%), and Immigrants from Ireland (80.7%, a difference of 0.030%).
| Demographics | Rating | Rank | In Labor Force | Age 20-64 |
| Immigrants | Bosnia and Herzegovina | 100.0 /100 | #23 | Exceptional 80.8% |
| Immigrants | Morocco | 100.0 /100 | #24 | Exceptional 80.8% |
| Kenyans | 100.0 /100 | #25 | Exceptional 80.8% |
| Immigrants | Serbia | 100.0 /100 | #26 | Exceptional 80.8% |
| Immigrants | Kenya | 99.9 /100 | #27 | Exceptional 80.7% |
| Immigrants | Uganda | 99.9 /100 | #28 | Exceptional 80.7% |
| Immigrants | South Central Asia | 99.9 /100 | #29 | Exceptional 80.7% |
| Immigrants | North Macedonia | 99.9 /100 | #30 | Exceptional 80.7% |
| Immigrants | Lithuania | 99.9 /100 | #31 | Exceptional 80.7% |
| Immigrants | Ireland | 99.9 /100 | #32 | Exceptional 80.7% |
| Chinese | 99.9 /100 | #33 | Exceptional 80.7% |
| Immigrants | Brazil | 99.9 /100 | #34 | Exceptional 80.7% |
| Immigrants | Poland | 99.9 /100 | #35 | Exceptional 80.6% |
| Paraguayans | 99.8 /100 | #36 | Exceptional 80.6% |
| Immigrants | Moldova | 99.8 /100 | #37 | Exceptional 80.6% |
Demographics Similar to Europeans by In Labor Force | Age 20-64
In terms of in labor force | age 20-64, the demographic groups most similar to Europeans are Haitian (79.3%, a difference of 0.010%), Immigrants from Ecuador (79.3%, a difference of 0.020%), Subsaharan African (79.3%, a difference of 0.020%), British (79.3%, a difference of 0.020%), and Bangladeshi (79.3%, a difference of 0.020%).
| Demographics | Rating | Rank | In Labor Force | Age 20-64 |
| Immigrants | Cambodia | 17.6 /100 | #204 | Poor 79.3% |
| Immigrants | Congo | 17.5 /100 | #205 | Poor 79.3% |
| Immigrants | Ecuador | 16.9 /100 | #206 | Poor 79.3% |
| Sub-Saharan Africans | 16.5 /100 | #207 | Poor 79.3% |
| British | 16.5 /100 | #208 | Poor 79.3% |
| Bangladeshis | 16.4 /100 | #209 | Poor 79.3% |
| Haitians | 16.1 /100 | #210 | Poor 79.3% |
| Europeans | 15.3 /100 | #211 | Poor 79.3% |
| Irish | 13.2 /100 | #212 | Poor 79.3% |
| Immigrants | Portugal | 12.8 /100 | #213 | Poor 79.3% |
| Immigrants | Armenia | 12.2 /100 | #214 | Poor 79.2% |
| Immigrants | Norway | 12.0 /100 | #215 | Poor 79.2% |
| Arabs | 11.4 /100 | #216 | Poor 79.2% |
| Immigrants | Western Asia | 11.0 /100 | #217 | Poor 79.2% |
| Immigrants | England | 9.3 /100 | #218 | Tragic 79.2% |