Immigrants from Zimbabwe vs Sierra Leonean In Labor Force | Age 45-54

COMPARE

Immigrants from Zimbabwe
Race
Ancestry
AfghanAfricanAlaska NativeAlaskan AthabascanAlbanianAleutAlsatianAmericanApacheArabArapahoArgentineanArmenianAssyrian/Chaldean/SyriacAustralianAustrianBahamianBangladeshiBarbadianBasqueBelgianBelizeanBermudanBhutaneseBlackfeetBolivianBrazilianBritishBritish West IndianBulgarianBurmeseCajunCambodianCanadianCape VerdeanCarpatho RusynCelticCentral AmericanCentral American IndianCherokeeCheyenneChickasawChileanChineseChippewaChoctawColombianColvilleComancheCosta RicanCreeCreekCroatianCrowCubanCypriotCzechCzechoslovakianDanishDelawareDominicanDutchDutch West IndianEastern EuropeanEcuadorianEgyptianEnglishEstonianEthiopianEuropeanFijianFilipinoFinnishFrenchFrench American IndianFrench CanadianGermanGerman RussianGhanaianGreekGuamanian/ChamorroGuatemalanGuyaneseHaitianHmongHonduranHopiHoumaHungarianIcelanderIndian (Asian)IndonesianInupiatIranianIraqiIrishIroquoisIsraeliItalianJamaicanJapaneseJordanianKenyanKiowaKoreanLaotianLatvianLebaneseLiberianLithuanianLumbeeLuxembourgerMacedonianMalaysianMalteseMarshalleseMenomineeMexicanMexican American IndianMongolianMoroccanNative HawaiianNavajoNepaleseNew ZealanderNicaraguanNigerianNorthern EuropeanNorwegianOkinawanOsageOttawaPaiutePakistaniPalestinianPanamanianParaguayanPennsylvania GermanPeruvianPimaPolishPortuguesePotawatomiPuebloPuerto RicanPuget Sound SalishRomanianRussianSalvadoranSamoanScandinavianScotch-IrishScottishSeminoleSenegaleseSerbianShoshoneSiouxSlavicSlovakSloveneSomaliSouth AfricanSouth AmericanSouth American IndianSoviet UnionSpaniardSpanishSpanish AmericanSpanish American IndianSri LankanSubsaharan AfricanSudaneseSwedishSwissSyrianTaiwaneseThaiTlingit-HaidaTohono O'OdhamTonganTrinidadian and TobagonianTsimshianTurkishU.S. Virgin IslanderUgandanUkrainianUruguayanUteVenezuelanVietnameseWelshWest IndianYakamaYaquiYugoslavianYumanYup'ikZimbabwean
Immigration
NonimmigrantsImmigrantsAfghanistanAfricaAlbaniaArgentinaArmeniaAsiaAustraliaAustriaBahamasBangladeshBarbadosBelarusBelgiumBelizeBoliviaBosnia and HerzegovinaBrazilBulgariaBurma/MyanmarCabo VerdeCambodiaCameroonCanadaCaribbeanCentral AmericaChileChinaColombiaCongoCosta RicaCroatiaCubaCzechoslovakiaDenmarkDominicaDominican RepublicEastern AfricaEastern AsiaEastern EuropeEcuadorEgyptEl SalvadorEnglandEritreaEthiopiaEuropeFijiFranceGermanyGhanaGreeceGrenadaGuatemalaGuyanaHaitiHondurasHong KongHungaryIndiaIndonesiaIranIraqIrelandIsraelItalyJamaicaJapanJordanKazakhstanKenyaKoreaKuwaitLaosLatin AmericaLatviaLebanonLiberiaLithuaniaMalaysiaMexicoMicronesiaMiddle AfricaMoldovaMoroccoNepalNetherlandsNicaraguaNigeriaNorth AmericaNorth MacedoniaNorthern AfricaNorthern EuropeNorwayOceaniaPakistanPanamaPeruPhilippinesPolandPortugalRomaniaRussiaSaudi ArabiaScotlandSenegalSerbiaSierra LeoneSingaporeSomaliaSouth AfricaSouth AmericaSouth Central AsiaSouth Eastern AsiaSouthern EuropeSpainSri LankaSt. Vincent and the GrenadinesSudanSwedenSwitzerlandSyriaTaiwanThailandTrinidad and TobagoTurkeyUgandaUkraineUruguayUzbekistanVenezuelaVietnamWest IndiesWestern AfricaWestern AsiaWestern EuropeYemenZaireZimbabweAzores
Sierra Leonean
Race
Ancestry
AfghanAfricanAlaska NativeAlaskan AthabascanAlbanianAleutAlsatianAmericanApacheArabArapahoArgentineanArmenianAssyrian/Chaldean/SyriacAustralianAustrianBahamianBangladeshiBarbadianBasqueBelgianBelizeanBermudanBhutaneseBlackfeetBolivianBrazilianBritishBritish West IndianBulgarianBurmeseCajunCambodianCanadianCape VerdeanCarpatho RusynCelticCentral AmericanCentral American IndianCherokeeCheyenneChickasawChileanChineseChippewaChoctawColombianColvilleComancheCosta RicanCreeCreekCroatianCrowCubanCypriotCzechCzechoslovakianDanishDelawareDominicanDutchDutch West IndianEastern EuropeanEcuadorianEgyptianEnglishEstonianEthiopianEuropeanFijianFilipinoFinnishFrenchFrench American IndianFrench CanadianGermanGerman RussianGhanaianGreekGuamanian/ChamorroGuatemalanGuyaneseHaitianHmongHonduranHopiHoumaHungarianIcelanderIndian (Asian)IndonesianInupiatIranianIraqiIrishIroquoisIsraeliItalianJamaicanJapaneseJordanianKenyanKiowaKoreanLaotianLatvianLebaneseLiberianLithuanianLumbeeLuxembourgerMacedonianMalaysianMalteseMarshalleseMenomineeMexicanMexican American IndianMongolianMoroccanNative HawaiianNavajoNepaleseNew ZealanderNicaraguanNigerianNorthern EuropeanNorwegianOkinawanOsageOttawaPaiutePakistaniPalestinianPanamanianParaguayanPennsylvania GermanPeruvianPimaPolishPortuguesePotawatomiPuebloPuerto RicanPuget Sound SalishRomanianRussianSalvadoranSamoanScandinavianScotch-IrishScottishSeminoleSenegaleseSerbianShoshoneSierra LeoneanSiouxSlavicSlovakSloveneSomaliSouth AfricanSouth AmericanSouth American IndianSoviet UnionSpaniardSpanishSpanish AmericanSpanish American IndianSri LankanSubsaharan AfricanSudaneseSwedishSwissSyrianTaiwaneseThaiTlingit-HaidaTohono O'OdhamTonganTrinidadian and TobagonianTsimshianTurkishU.S. Virgin IslanderUgandanUkrainianUruguayanUteVenezuelanVietnameseWelshWest IndianYakamaYaquiYugoslavianYumanYup'ikZimbabwean
Immigration
NonimmigrantsImmigrantsAfghanistanAfricaAlbaniaArgentinaArmeniaAsiaAustraliaAustriaBahamasBangladeshBarbadosBelarusBelgiumBelizeBoliviaBosnia and HerzegovinaBrazilBulgariaBurma/MyanmarCabo VerdeCambodiaCameroonCanadaCaribbeanCentral AmericaChileChinaColombiaCongoCosta RicaCroatiaCubaCzechoslovakiaDenmarkDominicaDominican RepublicEastern AfricaEastern AsiaEastern EuropeEcuadorEgyptEl SalvadorEnglandEritreaEthiopiaEuropeFijiFranceGermanyGhanaGreeceGrenadaGuatemalaGuyanaHaitiHondurasHong KongHungaryIndiaIndonesiaIranIraqIrelandIsraelItalyJamaicaJapanJordanKazakhstanKenyaKoreaKuwaitLaosLatin AmericaLatviaLebanonLiberiaLithuaniaMalaysiaMexicoMicronesiaMiddle AfricaMoldovaMoroccoNepalNetherlandsNicaraguaNigeriaNorth AmericaNorth MacedoniaNorthern AfricaNorthern EuropeNorwayOceaniaPakistanPanamaPeruPhilippinesPolandPortugalRomaniaRussiaSaudi ArabiaScotlandSenegalSerbiaSierra LeoneSingaporeSomaliaSouth AfricaSouth AmericaSouth Central AsiaSouth Eastern AsiaSouthern EuropeSpainSri LankaSt. Vincent and the GrenadinesSudanSwedenSwitzerlandSyriaTaiwanThailandTrinidad and TobagoTurkeyUgandaUkraineUruguayUzbekistanVenezuelaVietnamWest IndiesWestern AfricaWestern AsiaWestern EuropeYemenZaireAzores
In Labor Force | Age 45-54
Income
Poverty
Unemployment
Labor Participation
Family Structure
Vehicle Availability
Education Level
Disability

In Labor Force | Age 45-54 Comparison

Immigrants from Zimbabwe

Sierra Leoneans

Exceptional
Exceptional
83.4%
IN LABOR FORCE | AGE 45-54
96.3/ 100
METRIC RATING
83rd/ 347
METRIC RANK
84.5%
IN LABOR FORCE | AGE 45-54
100.0/ 100
METRIC RATING
8th/ 347
METRIC RANK

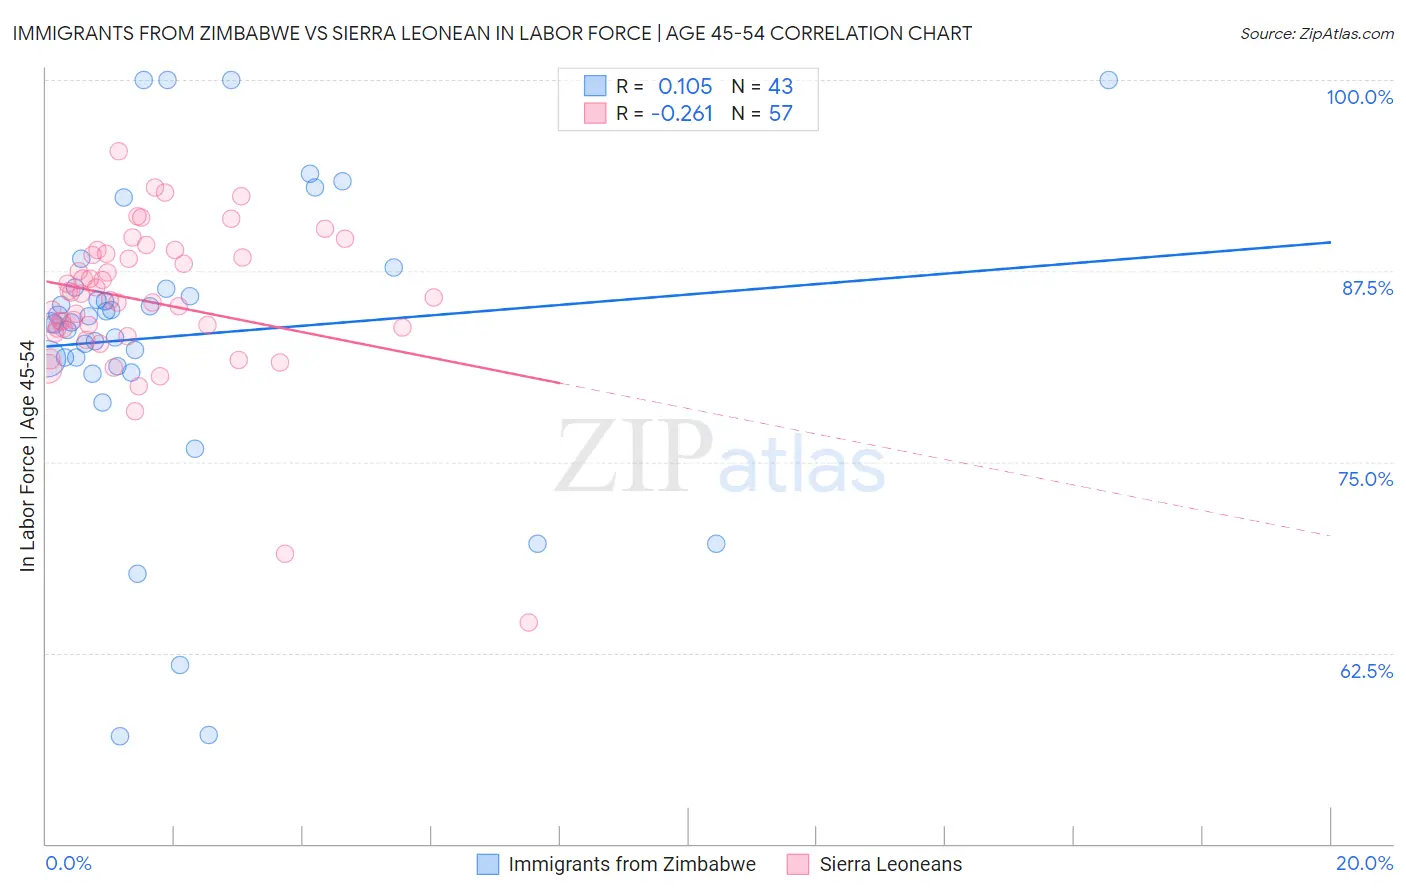
Immigrants from Zimbabwe vs Sierra Leonean In Labor Force | Age 45-54 Correlation Chart

The statistical analysis conducted on geographies consisting of 117,788,320 people shows a poor positive correlation between the proportion of Immigrants from Zimbabwe and labor force participation rate among population between the ages 45 and 54 in the United States with a correlation coefficient (R) of 0.105 and weighted average of 83.4%. Similarly, the statistical analysis conducted on geographies consisting of 83,350,060 people shows a weak negative correlation between the proportion of Sierra Leoneans and labor force participation rate among population between the ages 45 and 54 in the United States with a correlation coefficient (R) of -0.261 and weighted average of 84.5%, a difference of 1.4%.
Immigrants from Zimbabwe vs Sierra Leonean In Labor Force | Age 45-54

In Labor Force | Age 45-54 Correlation Summary

MeasurementImmigrants from ZimbabweSierra Leonean
Minimum57.0%64.5%
Maximum100.0%95.3%
Range43.0%30.8%
Mean83.3%85.5%
Median84.1%85.8%
Interquartile 25% (IQ1)81.2%83.6%
Interquartile 75% (IQ3)86.4%88.6%
Interquartile Range (IQR)5.1%5.0%
Standard Deviation (Sample)10.0%5.1%
Standard Deviation (Population)9.8%5.0%

Similar Demographics by In Labor Force | Age 45-54

Demographics Similar to Immigrants from Zimbabwe by In Labor Force | Age 45-54

In terms of in labor force | age 45-54, the demographic groups most similar to Immigrants from Zimbabwe are Immigrants from Eastern Asia (83.4%, a difference of 0.0%), Immigrants from Croatia (83.4%, a difference of 0.010%), Jordanian (83.4%, a difference of 0.010%), Immigrants from Bosnia and Herzegovina (83.3%, a difference of 0.010%), and Immigrants from Egypt (83.4%, a difference of 0.020%).
DemographicsRating | RankIn Labor Force | Age 45-54
Russians
96.8
/100
|
#76
Exceptional
83.4%
Cubans
96.7
/100
|
#77
Exceptional
83.4%
Immigrants | Egypt
96.6
/100
|
#78
Exceptional
83.4%
Belgians
96.5
/100
|
#79
Exceptional
83.4%
Immigrants | Croatia
96.5
/100
|
#80
Exceptional
83.4%
Jordanians
96.4
/100
|
#81
Exceptional
83.4%
Immigrants | Eastern Asia
96.3
/100
|
#82
Exceptional
83.4%
Immigrants | Zimbabwe
96.3
/100
|
#83
Exceptional
83.4%
Immigrants | Bosnia and Herzegovina
96.0
/100
|
#84
Exceptional
83.3%
Greeks
95.9
/100
|
#85
Exceptional
83.3%
Immigrants | Northern Africa
95.7
/100
|
#86
Exceptional
83.3%
Immigrants | Eastern Europe
95.6
/100
|
#87
Exceptional
83.3%
Immigrants | Asia
95.6
/100
|
#88
Exceptional
83.3%
Indians (Asian)
95.5
/100
|
#89
Exceptional
83.3%
Immigrants | Japan
95.5
/100
|
#90
Exceptional
83.3%

Demographics Similar to Sierra Leoneans by In Labor Force | Age 45-54

In terms of in labor force | age 45-54, the demographic groups most similar to Sierra Leoneans are Immigrants from Cameroon (84.6%, a difference of 0.11%), Immigrants from Sierra Leone (84.4%, a difference of 0.11%), Norwegian (84.4%, a difference of 0.13%), Immigrants from India (84.7%, a difference of 0.18%), and Thai (84.3%, a difference of 0.22%).
DemographicsRating | RankIn Labor Force | Age 45-54
Immigrants | Bolivia
100.0
/100
|
#1
Exceptional
85.3%
Luxembourgers
100.0
/100
|
#2
Exceptional
85.0%
Bolivians
100.0
/100
|
#3
Exceptional
84.9%
Immigrants | Ethiopia
100.0
/100
|
#4
Exceptional
84.8%
Ethiopians
100.0
/100
|
#5
Exceptional
84.8%
Immigrants | India
100.0
/100
|
#6
Exceptional
84.7%
Immigrants | Cameroon
100.0
/100
|
#7
Exceptional
84.6%
Sierra Leoneans
100.0
/100
|
#8
Exceptional
84.5%
Immigrants | Sierra Leone
100.0
/100
|
#9
Exceptional
84.4%
Norwegians
100.0
/100
|
#10
Exceptional
84.4%
Thais
100.0
/100
|
#11
Exceptional
84.3%
Bulgarians
100.0
/100
|
#12
Exceptional
84.2%
Chinese
99.9
/100
|
#13
Exceptional
84.1%
Cambodians
99.9
/100
|
#14
Exceptional
84.1%
Cypriots
99.9
/100
|
#15
Exceptional
84.1%