Immigrants from Nicaragua vs Russian In Labor Force | Age 35-44
COMPARE
Immigrants from Nicaragua
Russian
In Labor Force | Age 35-44
In Labor Force | Age 35-44 Comparison
Immigrants from Nicaragua
Russians
84.1%
IN LABOR FORCE | AGE 35-44
9.4/ 100
METRIC RATING
218th/ 347
METRIC RANK
85.0%
IN LABOR FORCE | AGE 35-44
99.0/ 100
METRIC RATING
71st/ 347
METRIC RANK
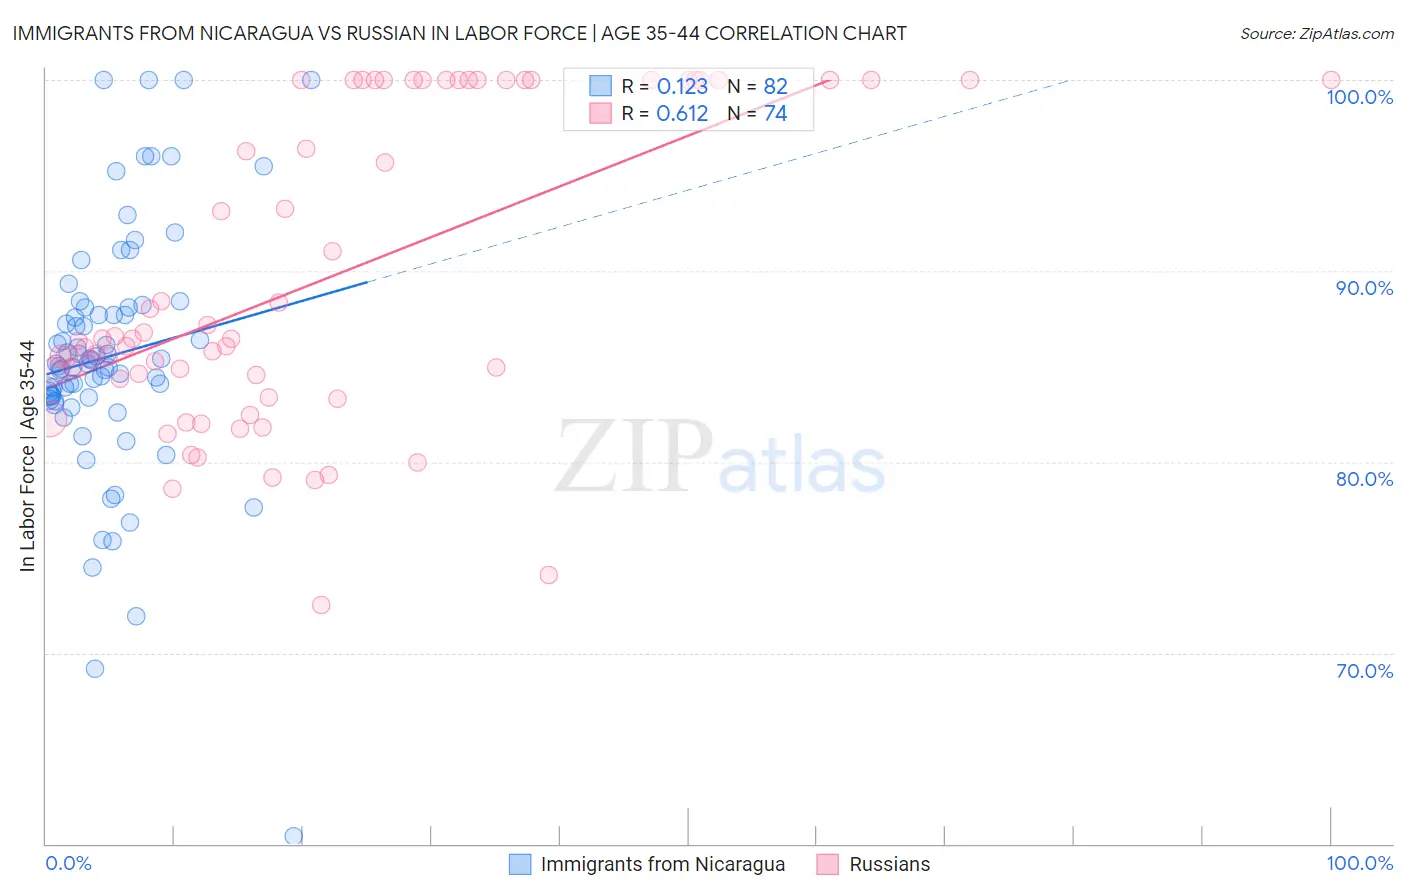
Immigrants from Nicaragua vs Russian In Labor Force | Age 35-44 Correlation Chart
The statistical analysis conducted on geographies consisting of 236,329,760 people shows a poor positive correlation between the proportion of Immigrants from Nicaragua and labor force participation rate among population between the ages 35 and 44 in the United States with a correlation coefficient (R) of 0.123 and weighted average of 84.1%. Similarly, the statistical analysis conducted on geographies consisting of 511,787,854 people shows a significant positive correlation between the proportion of Russians and labor force participation rate among population between the ages 35 and 44 in the United States with a correlation coefficient (R) of 0.612 and weighted average of 85.0%, a difference of 1.1%.
In Labor Force | Age 35-44 Correlation Summary
| Measurement | Immigrants from Nicaragua | Russian |
| Minimum | 60.4% | 72.5% |
| Maximum | 100.0% | 100.0% |
| Range | 39.6% | 27.5% |
| Mean | 85.5% | 89.6% |
| Median | 85.1% | 86.5% |
| Interquartile 25% (IQ1) | 83.4% | 84.4% |
| Interquartile 75% (IQ3) | 88.1% | 100.0% |
| Interquartile Range (IQR) | 4.7% | 15.6% |
| Standard Deviation (Sample) | 6.6% | 8.1% |
| Standard Deviation (Population) | 6.5% | 8.0% |
Similar Demographics by In Labor Force | Age 35-44
Demographics Similar to Immigrants from Nicaragua by In Labor Force | Age 35-44
In terms of in labor force | age 35-44, the demographic groups most similar to Immigrants from Nicaragua are Subsaharan African (84.1%, a difference of 0.0%), Immigrants from Norway (84.1%, a difference of 0.040%), French (84.0%, a difference of 0.040%), European (84.1%, a difference of 0.050%), and Nicaraguan (84.1%, a difference of 0.050%).
| Demographics | Rating | Rank | In Labor Force | Age 35-44 |
| Immigrants | Ecuador | 15.2 /100 | #211 | Poor 84.1% |
| Israelis | 14.0 /100 | #212 | Poor 84.1% |
| Bangladeshis | 13.7 /100 | #213 | Poor 84.1% |
| Immigrants | Barbados | 13.2 /100 | #214 | Poor 84.1% |
| Europeans | 12.2 /100 | #215 | Poor 84.1% |
| Nicaraguans | 12.1 /100 | #216 | Poor 84.1% |
| Immigrants | Norway | 11.7 /100 | #217 | Poor 84.1% |
| Immigrants | Nicaragua | 9.4 /100 | #218 | Tragic 84.1% |
| Sub-Saharan Africans | 9.3 /100 | #219 | Tragic 84.1% |
| French | 7.5 /100 | #220 | Tragic 84.0% |
| Icelanders | 6.7 /100 | #221 | Tragic 84.0% |
| Assyrians/Chaldeans/Syriacs | 6.6 /100 | #222 | Tragic 84.0% |
| Immigrants | Panama | 6.4 /100 | #223 | Tragic 84.0% |
| U.S. Virgin Islanders | 6.1 /100 | #224 | Tragic 84.0% |
| Immigrants | Burma/Myanmar | 6.1 /100 | #225 | Tragic 84.0% |
Demographics Similar to Russians by In Labor Force | Age 35-44
In terms of in labor force | age 35-44, the demographic groups most similar to Russians are Brazilian (85.0%, a difference of 0.0%), Sudanese (85.0%, a difference of 0.010%), Immigrants from Italy (85.0%, a difference of 0.020%), Italian (85.0%, a difference of 0.020%), and Immigrants from Singapore (85.0%, a difference of 0.020%).
| Demographics | Rating | Rank | In Labor Force | Age 35-44 |
| Swedes | 99.2 /100 | #64 | Exceptional 85.0% |
| Immigrants | Brazil | 99.2 /100 | #65 | Exceptional 85.0% |
| Immigrants | Haiti | 99.1 /100 | #66 | Exceptional 85.0% |
| Immigrants | Italy | 99.1 /100 | #67 | Exceptional 85.0% |
| Italians | 99.1 /100 | #68 | Exceptional 85.0% |
| Sudanese | 99.0 /100 | #69 | Exceptional 85.0% |
| Brazilians | 99.0 /100 | #70 | Exceptional 85.0% |
| Russians | 99.0 /100 | #71 | Exceptional 85.0% |
| Immigrants | Singapore | 98.9 /100 | #72 | Exceptional 85.0% |
| Immigrants | Sri Lanka | 98.9 /100 | #73 | Exceptional 85.0% |
| Colombians | 98.8 /100 | #74 | Exceptional 85.0% |
| Immigrants | South Central Asia | 98.7 /100 | #75 | Exceptional 85.0% |
| Immigrants | Cuba | 98.6 /100 | #76 | Exceptional 84.9% |
| Immigrants | Turkey | 98.6 /100 | #77 | Exceptional 84.9% |
| Immigrants | Africa | 98.4 /100 | #78 | Exceptional 84.9% |