Immigrants from Nicaragua vs Guamanian/Chamorro In Labor Force | Age 35-44
COMPARE
Immigrants from Nicaragua
Guamanian/Chamorro
In Labor Force | Age 35-44
In Labor Force | Age 35-44 Comparison
Immigrants from Nicaragua
Guamanians/Chamorros
84.1%
IN LABOR FORCE | AGE 35-44
9.4/ 100
METRIC RATING
218th/ 347
METRIC RANK
83.4%
IN LABOR FORCE | AGE 35-44
0.1/ 100
METRIC RATING
267th/ 347
METRIC RANK
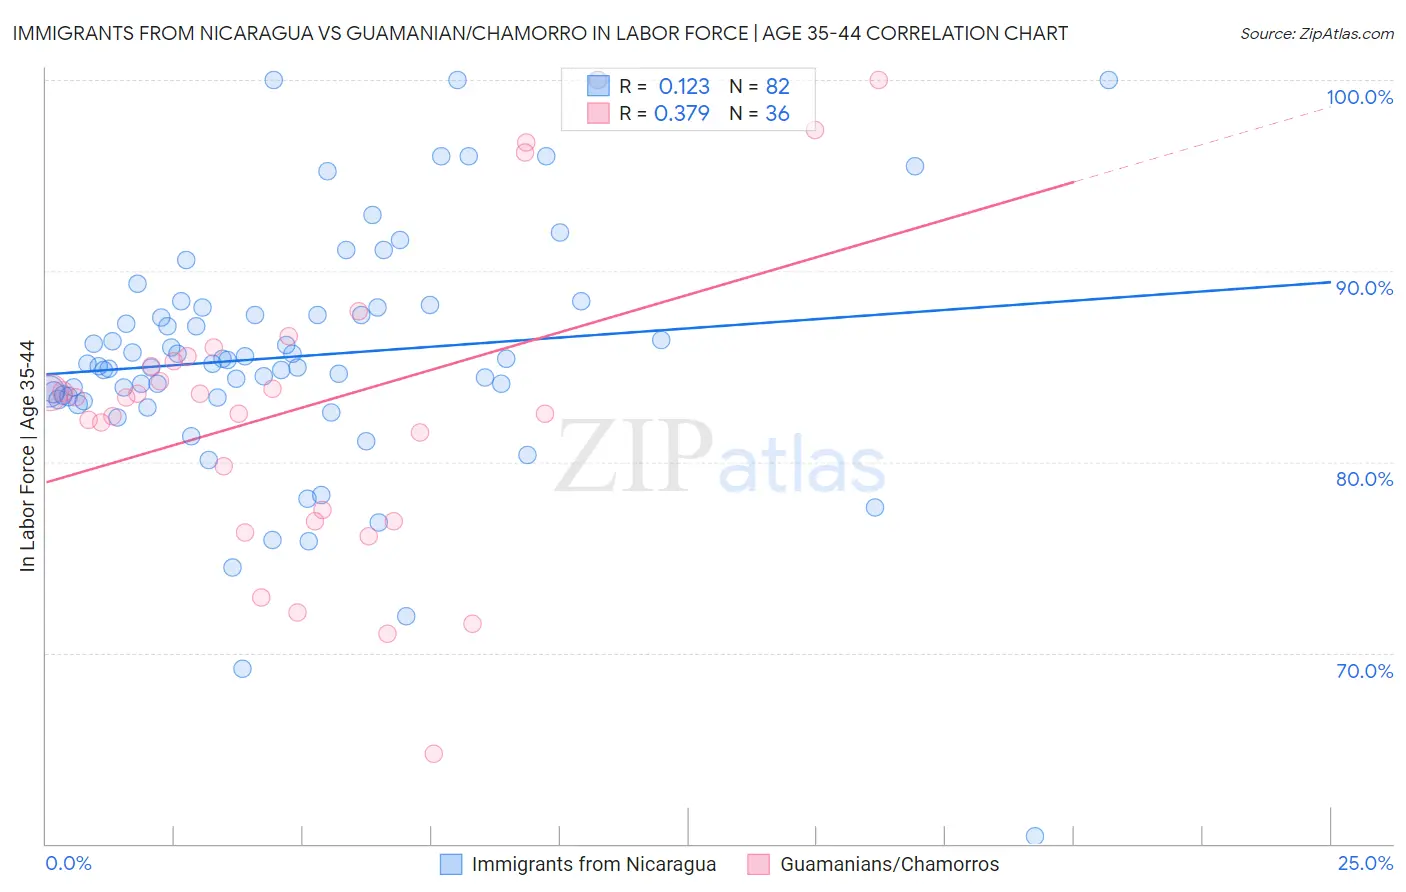
Immigrants from Nicaragua vs Guamanian/Chamorro In Labor Force | Age 35-44 Correlation Chart
The statistical analysis conducted on geographies consisting of 236,329,760 people shows a poor positive correlation between the proportion of Immigrants from Nicaragua and labor force participation rate among population between the ages 35 and 44 in the United States with a correlation coefficient (R) of 0.123 and weighted average of 84.1%. Similarly, the statistical analysis conducted on geographies consisting of 221,926,114 people shows a mild positive correlation between the proportion of Guamanians/Chamorros and labor force participation rate among population between the ages 35 and 44 in the United States with a correlation coefficient (R) of 0.379 and weighted average of 83.4%, a difference of 0.81%.
In Labor Force | Age 35-44 Correlation Summary
| Measurement | Immigrants from Nicaragua | Guamanian/Chamorro |
| Minimum | 60.4% | 64.7% |
| Maximum | 100.0% | 100.0% |
| Range | 39.6% | 35.3% |
| Mean | 85.5% | 82.9% |
| Median | 85.1% | 83.4% |
| Interquartile 25% (IQ1) | 83.4% | 77.2% |
| Interquartile 75% (IQ3) | 88.1% | 85.4% |
| Interquartile Range (IQR) | 4.7% | 8.2% |
| Standard Deviation (Sample) | 6.6% | 8.0% |
| Standard Deviation (Population) | 6.5% | 7.9% |
Similar Demographics by In Labor Force | Age 35-44
Demographics Similar to Immigrants from Nicaragua by In Labor Force | Age 35-44
In terms of in labor force | age 35-44, the demographic groups most similar to Immigrants from Nicaragua are Subsaharan African (84.1%, a difference of 0.0%), Immigrants from Norway (84.1%, a difference of 0.040%), French (84.0%, a difference of 0.040%), European (84.1%, a difference of 0.050%), and Nicaraguan (84.1%, a difference of 0.050%).
| Demographics | Rating | Rank | In Labor Force | Age 35-44 |
| Immigrants | Ecuador | 15.2 /100 | #211 | Poor 84.1% |
| Israelis | 14.0 /100 | #212 | Poor 84.1% |
| Bangladeshis | 13.7 /100 | #213 | Poor 84.1% |
| Immigrants | Barbados | 13.2 /100 | #214 | Poor 84.1% |
| Europeans | 12.2 /100 | #215 | Poor 84.1% |
| Nicaraguans | 12.1 /100 | #216 | Poor 84.1% |
| Immigrants | Norway | 11.7 /100 | #217 | Poor 84.1% |
| Immigrants | Nicaragua | 9.4 /100 | #218 | Tragic 84.1% |
| Sub-Saharan Africans | 9.3 /100 | #219 | Tragic 84.1% |
| French | 7.5 /100 | #220 | Tragic 84.0% |
| Icelanders | 6.7 /100 | #221 | Tragic 84.0% |
| Assyrians/Chaldeans/Syriacs | 6.6 /100 | #222 | Tragic 84.0% |
| Immigrants | Panama | 6.4 /100 | #223 | Tragic 84.0% |
| U.S. Virgin Islanders | 6.1 /100 | #224 | Tragic 84.0% |
| Immigrants | Burma/Myanmar | 6.1 /100 | #225 | Tragic 84.0% |
Demographics Similar to Guamanians/Chamorros by In Labor Force | Age 35-44
In terms of in labor force | age 35-44, the demographic groups most similar to Guamanians/Chamorros are Honduran (83.4%, a difference of 0.030%), Immigrants from Grenada (83.3%, a difference of 0.040%), Spaniard (83.4%, a difference of 0.050%), Central American (83.5%, a difference of 0.080%), and Scotch-Irish (83.5%, a difference of 0.090%).
| Demographics | Rating | Rank | In Labor Force | Age 35-44 |
| Vietnamese | 0.2 /100 | #260 | Tragic 83.5% |
| Immigrants | Dominica | 0.2 /100 | #261 | Tragic 83.5% |
| Immigrants | Congo | 0.2 /100 | #262 | Tragic 83.5% |
| Iroquois | 0.2 /100 | #263 | Tragic 83.5% |
| Scotch-Irish | 0.1 /100 | #264 | Tragic 83.5% |
| Central Americans | 0.1 /100 | #265 | Tragic 83.5% |
| Spaniards | 0.1 /100 | #266 | Tragic 83.4% |
| Guamanians/Chamorros | 0.1 /100 | #267 | Tragic 83.4% |
| Hondurans | 0.1 /100 | #268 | Tragic 83.4% |
| Immigrants | Grenada | 0.1 /100 | #269 | Tragic 83.3% |
| Immigrants | Honduras | 0.0 /100 | #270 | Tragic 83.3% |
| French American Indians | 0.0 /100 | #271 | Tragic 83.2% |
| Immigrants | Fiji | 0.0 /100 | #272 | Tragic 83.2% |
| Spanish | 0.0 /100 | #273 | Tragic 83.2% |
| Immigrants | Nonimmigrants | 0.0 /100 | #274 | Tragic 83.2% |