Mongolian vs Russian In Labor Force | Age 35-44
COMPARE
Mongolian
Russian
In Labor Force | Age 35-44
In Labor Force | Age 35-44 Comparison
Mongolians
Russians
84.8%
IN LABOR FORCE | AGE 35-44
96.8/ 100
METRIC RATING
94th/ 347
METRIC RANK
85.0%
IN LABOR FORCE | AGE 35-44
99.0/ 100
METRIC RATING
71st/ 347
METRIC RANK
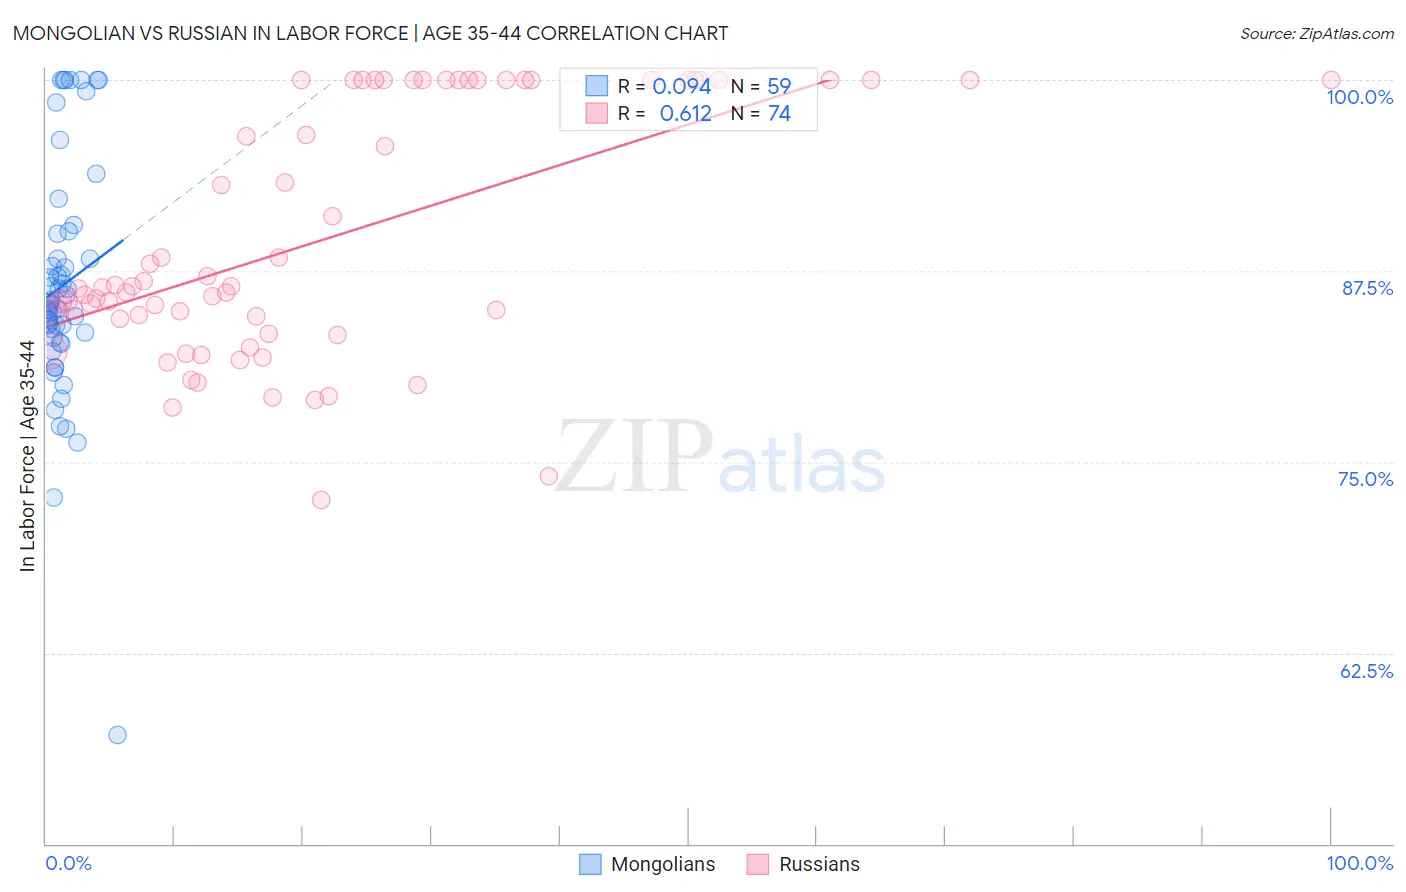
Mongolian vs Russian In Labor Force | Age 35-44 Correlation Chart
The statistical analysis conducted on geographies consisting of 140,321,918 people shows a slight positive correlation between the proportion of Mongolians and labor force participation rate among population between the ages 35 and 44 in the United States with a correlation coefficient (R) of 0.094 and weighted average of 84.8%. Similarly, the statistical analysis conducted on geographies consisting of 511,787,854 people shows a significant positive correlation between the proportion of Russians and labor force participation rate among population between the ages 35 and 44 in the United States with a correlation coefficient (R) of 0.612 and weighted average of 85.0%, a difference of 0.19%.
In Labor Force | Age 35-44 Correlation Summary
| Measurement | Mongolian | Russian |
| Minimum | 57.1% | 72.5% |
| Maximum | 100.0% | 100.0% |
| Range | 42.9% | 27.5% |
| Mean | 86.6% | 89.6% |
| Median | 85.4% | 86.5% |
| Interquartile 25% (IQ1) | 83.2% | 84.4% |
| Interquartile 75% (IQ3) | 89.9% | 100.0% |
| Interquartile Range (IQR) | 6.8% | 15.6% |
| Standard Deviation (Sample) | 7.8% | 8.1% |
| Standard Deviation (Population) | 7.7% | 8.0% |
Similar Demographics by In Labor Force | Age 35-44
Demographics Similar to Mongolians by In Labor Force | Age 35-44
In terms of in labor force | age 35-44, the demographic groups most similar to Mongolians are Immigrants from Kuwait (84.8%, a difference of 0.010%), Cuban (84.8%, a difference of 0.010%), Egyptian (84.8%, a difference of 0.010%), Immigrants from Europe (84.9%, a difference of 0.020%), and Ghanaian (84.8%, a difference of 0.020%).
| Demographics | Rating | Rank | In Labor Force | Age 35-44 |
| Belgians | 97.7 /100 | #87 | Exceptional 84.9% |
| Yugoslavians | 97.7 /100 | #88 | Exceptional 84.9% |
| Immigrants | Pakistan | 97.5 /100 | #89 | Exceptional 84.9% |
| Immigrants | France | 97.4 /100 | #90 | Exceptional 84.9% |
| Immigrants | Europe | 97.2 /100 | #91 | Exceptional 84.9% |
| Ghanaians | 97.2 /100 | #92 | Exceptional 84.8% |
| Immigrants | Northern Africa | 97.1 /100 | #93 | Exceptional 84.8% |
| Mongolians | 96.8 /100 | #94 | Exceptional 84.8% |
| Immigrants | Kuwait | 96.7 /100 | #95 | Exceptional 84.8% |
| Cubans | 96.6 /100 | #96 | Exceptional 84.8% |
| Egyptians | 96.6 /100 | #97 | Exceptional 84.8% |
| Indians (Asian) | 96.1 /100 | #98 | Exceptional 84.8% |
| Haitians | 96.0 /100 | #99 | Exceptional 84.8% |
| Immigrants | Czechoslovakia | 95.9 /100 | #100 | Exceptional 84.8% |
| Immigrants | Australia | 95.5 /100 | #101 | Exceptional 84.8% |
Demographics Similar to Russians by In Labor Force | Age 35-44
In terms of in labor force | age 35-44, the demographic groups most similar to Russians are Brazilian (85.0%, a difference of 0.0%), Sudanese (85.0%, a difference of 0.010%), Immigrants from Italy (85.0%, a difference of 0.020%), Italian (85.0%, a difference of 0.020%), and Immigrants from Singapore (85.0%, a difference of 0.020%).
| Demographics | Rating | Rank | In Labor Force | Age 35-44 |
| Swedes | 99.2 /100 | #64 | Exceptional 85.0% |
| Immigrants | Brazil | 99.2 /100 | #65 | Exceptional 85.0% |
| Immigrants | Haiti | 99.1 /100 | #66 | Exceptional 85.0% |
| Immigrants | Italy | 99.1 /100 | #67 | Exceptional 85.0% |
| Italians | 99.1 /100 | #68 | Exceptional 85.0% |
| Sudanese | 99.0 /100 | #69 | Exceptional 85.0% |
| Brazilians | 99.0 /100 | #70 | Exceptional 85.0% |
| Russians | 99.0 /100 | #71 | Exceptional 85.0% |
| Immigrants | Singapore | 98.9 /100 | #72 | Exceptional 85.0% |
| Immigrants | Sri Lanka | 98.9 /100 | #73 | Exceptional 85.0% |
| Colombians | 98.8 /100 | #74 | Exceptional 85.0% |
| Immigrants | South Central Asia | 98.7 /100 | #75 | Exceptional 85.0% |
| Immigrants | Cuba | 98.6 /100 | #76 | Exceptional 84.9% |
| Immigrants | Turkey | 98.6 /100 | #77 | Exceptional 84.9% |
| Immigrants | Africa | 98.4 /100 | #78 | Exceptional 84.9% |