Irish vs Russian In Labor Force | Age 35-44
COMPARE
Irish
Russian
In Labor Force | Age 35-44
In Labor Force | Age 35-44 Comparison
Irish
Russians
84.4%
IN LABOR FORCE | AGE 35-44
53.1/ 100
METRIC RATING
168th/ 347
METRIC RANK
85.0%
IN LABOR FORCE | AGE 35-44
99.0/ 100
METRIC RATING
71st/ 347
METRIC RANK
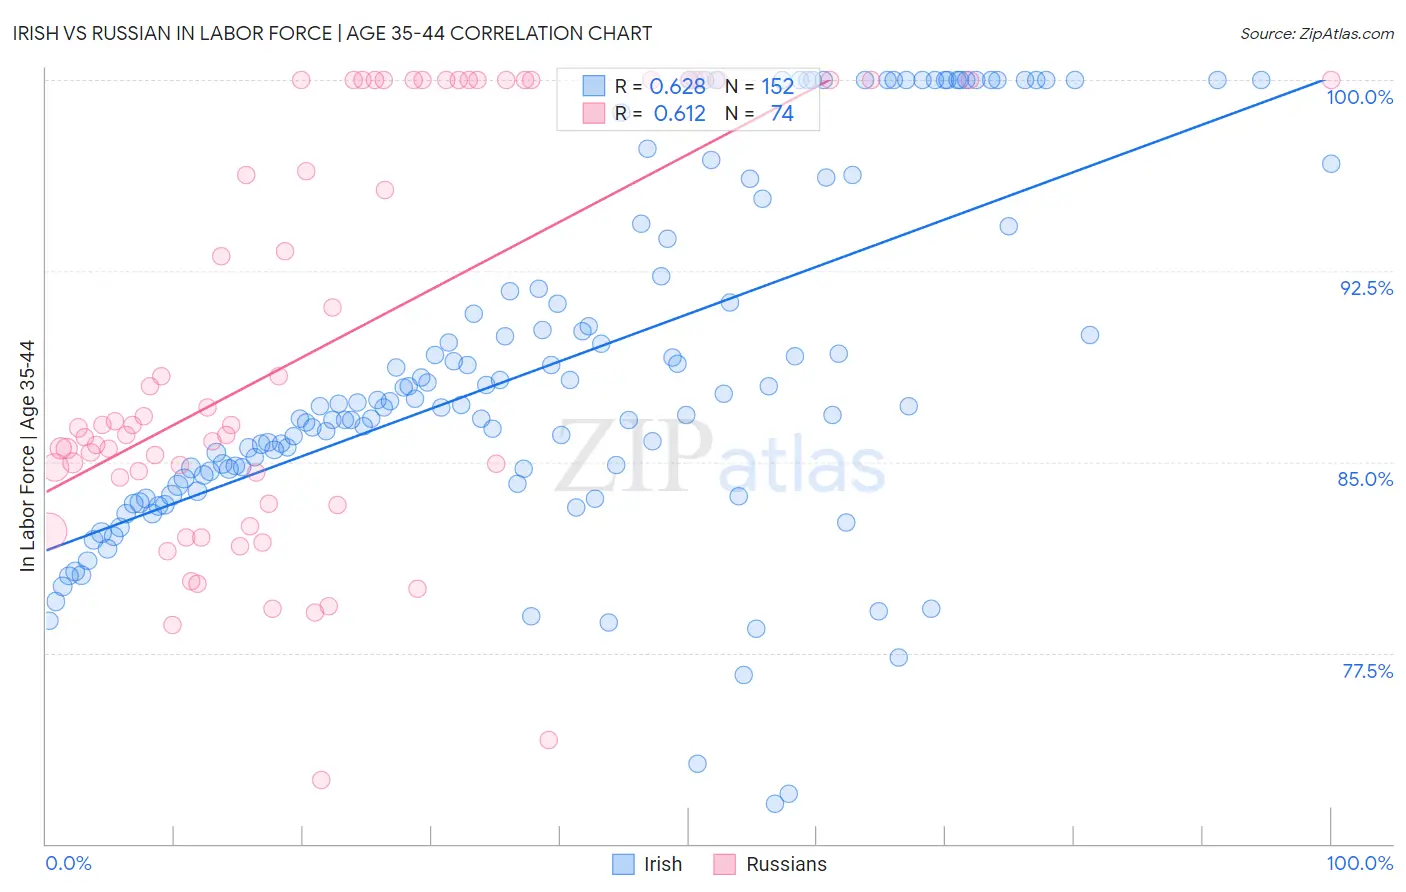
Irish vs Russian In Labor Force | Age 35-44 Correlation Chart
The statistical analysis conducted on geographies consisting of 579,649,730 people shows a significant positive correlation between the proportion of Irish and labor force participation rate among population between the ages 35 and 44 in the United States with a correlation coefficient (R) of 0.628 and weighted average of 84.4%. Similarly, the statistical analysis conducted on geographies consisting of 511,787,854 people shows a significant positive correlation between the proportion of Russians and labor force participation rate among population between the ages 35 and 44 in the United States with a correlation coefficient (R) of 0.612 and weighted average of 85.0%, a difference of 0.72%.
In Labor Force | Age 35-44 Correlation Summary
| Measurement | Irish | Russian |
| Minimum | 71.6% | 72.5% |
| Maximum | 100.0% | 100.0% |
| Range | 28.4% | 27.5% |
| Mean | 88.8% | 89.6% |
| Median | 87.2% | 86.5% |
| Interquartile 25% (IQ1) | 84.4% | 84.4% |
| Interquartile 75% (IQ3) | 94.0% | 100.0% |
| Interquartile Range (IQR) | 9.6% | 15.6% |
| Standard Deviation (Sample) | 7.0% | 8.1% |
| Standard Deviation (Population) | 6.9% | 8.0% |
Similar Demographics by In Labor Force | Age 35-44
Demographics Similar to Irish by In Labor Force | Age 35-44
In terms of in labor force | age 35-44, the demographic groups most similar to Irish are Immigrants from Afghanistan (84.4%, a difference of 0.0%), Immigrants from Jordan (84.4%, a difference of 0.0%), Alsatian (84.4%, a difference of 0.010%), Immigrants from Portugal (84.4%, a difference of 0.010%), and Jordanian (84.4%, a difference of 0.010%).
| Demographics | Rating | Rank | In Labor Force | Age 35-44 |
| Immigrants | Venezuela | 60.0 /100 | #161 | Good 84.4% |
| Immigrants | Hungary | 59.4 /100 | #162 | Average 84.4% |
| Aleuts | 59.1 /100 | #163 | Average 84.4% |
| Nigerians | 58.9 /100 | #164 | Average 84.4% |
| Venezuelans | 58.1 /100 | #165 | Average 84.4% |
| Alsatians | 55.2 /100 | #166 | Average 84.4% |
| Immigrants | Portugal | 55.2 /100 | #167 | Average 84.4% |
| Irish | 53.1 /100 | #168 | Average 84.4% |
| Immigrants | Afghanistan | 52.7 /100 | #169 | Average 84.4% |
| Immigrants | Jordan | 52.5 /100 | #170 | Average 84.4% |
| Jordanians | 51.7 /100 | #171 | Average 84.4% |
| Scandinavians | 51.2 /100 | #172 | Average 84.4% |
| Immigrants | Trinidad and Tobago | 50.7 /100 | #173 | Average 84.4% |
| Immigrants | Iran | 50.0 /100 | #174 | Average 84.4% |
| Pakistanis | 48.2 /100 | #175 | Average 84.4% |
Demographics Similar to Russians by In Labor Force | Age 35-44
In terms of in labor force | age 35-44, the demographic groups most similar to Russians are Brazilian (85.0%, a difference of 0.0%), Sudanese (85.0%, a difference of 0.010%), Immigrants from Italy (85.0%, a difference of 0.020%), Italian (85.0%, a difference of 0.020%), and Immigrants from Singapore (85.0%, a difference of 0.020%).
| Demographics | Rating | Rank | In Labor Force | Age 35-44 |
| Swedes | 99.2 /100 | #64 | Exceptional 85.0% |
| Immigrants | Brazil | 99.2 /100 | #65 | Exceptional 85.0% |
| Immigrants | Haiti | 99.1 /100 | #66 | Exceptional 85.0% |
| Immigrants | Italy | 99.1 /100 | #67 | Exceptional 85.0% |
| Italians | 99.1 /100 | #68 | Exceptional 85.0% |
| Sudanese | 99.0 /100 | #69 | Exceptional 85.0% |
| Brazilians | 99.0 /100 | #70 | Exceptional 85.0% |
| Russians | 99.0 /100 | #71 | Exceptional 85.0% |
| Immigrants | Singapore | 98.9 /100 | #72 | Exceptional 85.0% |
| Immigrants | Sri Lanka | 98.9 /100 | #73 | Exceptional 85.0% |
| Colombians | 98.8 /100 | #74 | Exceptional 85.0% |
| Immigrants | South Central Asia | 98.7 /100 | #75 | Exceptional 85.0% |
| Immigrants | Cuba | 98.6 /100 | #76 | Exceptional 84.9% |
| Immigrants | Turkey | 98.6 /100 | #77 | Exceptional 84.9% |
| Immigrants | Africa | 98.4 /100 | #78 | Exceptional 84.9% |