Immigrants from Nicaragua vs Russian Associate's Degree
COMPARE
Immigrants from Nicaragua
Russian
Associate's Degree
Associate's Degree Comparison
Immigrants from Nicaragua
Russians
40.3%
ASSOCIATE'S DEGREE
0.1/ 100
METRIC RATING
279th/ 347
METRIC RANK
53.2%
ASSOCIATE'S DEGREE
100.0/ 100
METRIC RATING
35th/ 347
METRIC RANK
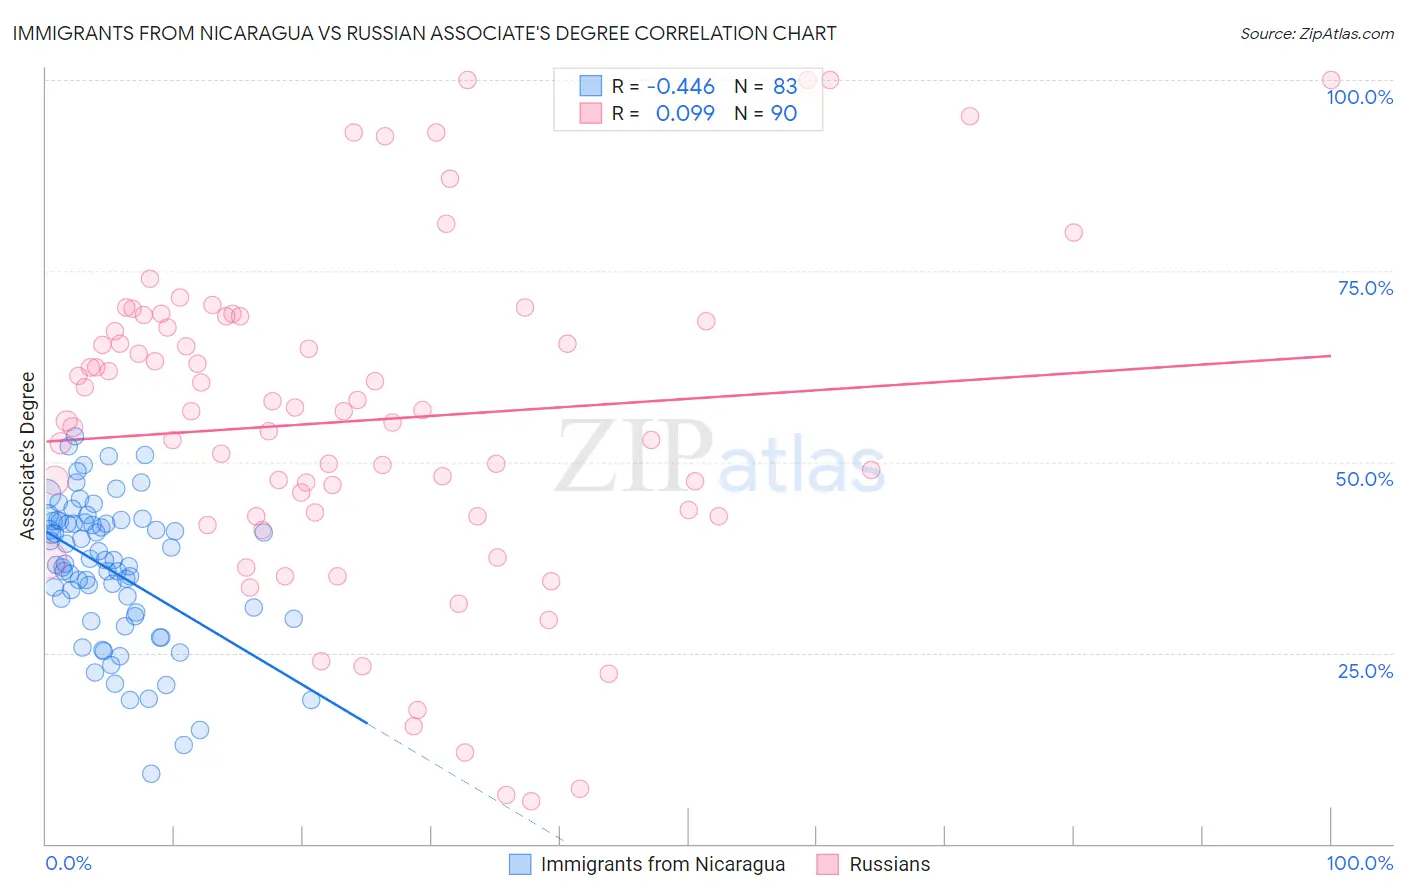
Immigrants from Nicaragua vs Russian Associate's Degree Correlation Chart
The statistical analysis conducted on geographies consisting of 236,338,316 people shows a moderate negative correlation between the proportion of Immigrants from Nicaragua and percentage of population with at least associate's degree education in the United States with a correlation coefficient (R) of -0.446 and weighted average of 40.3%. Similarly, the statistical analysis conducted on geographies consisting of 512,209,602 people shows a slight positive correlation between the proportion of Russians and percentage of population with at least associate's degree education in the United States with a correlation coefficient (R) of 0.099 and weighted average of 53.2%, a difference of 32.2%.
Associate's Degree Correlation Summary
| Measurement | Immigrants from Nicaragua | Russian |
| Minimum | 9.1% | 5.6% |
| Maximum | 53.3% | 100.0% |
| Range | 44.2% | 94.4% |
| Mean | 35.9% | 55.4% |
| Median | 37.1% | 56.6% |
| Interquartile 25% (IQ1) | 29.7% | 42.9% |
| Interquartile 75% (IQ3) | 42.2% | 68.4% |
| Interquartile Range (IQR) | 12.4% | 25.5% |
| Standard Deviation (Sample) | 9.4% | 21.5% |
| Standard Deviation (Population) | 9.3% | 21.3% |
Similar Demographics by Associate's Degree
Demographics Similar to Immigrants from Nicaragua by Associate's Degree
In terms of associate's degree, the demographic groups most similar to Immigrants from Nicaragua are Ottawa (40.3%, a difference of 0.040%), Blackfeet (40.3%, a difference of 0.19%), Immigrants from Micronesia (40.2%, a difference of 0.20%), Puerto Rican (40.4%, a difference of 0.24%), and Immigrants from Portugal (40.1%, a difference of 0.30%).
| Demographics | Rating | Rank | Associate's Degree |
| Belizeans | 0.1 /100 | #272 | Tragic 40.6% |
| Puget Sound Salish | 0.1 /100 | #273 | Tragic 40.5% |
| Immigrants | Dominica | 0.1 /100 | #274 | Tragic 40.5% |
| Potawatomi | 0.1 /100 | #275 | Tragic 40.4% |
| Puerto Ricans | 0.1 /100 | #276 | Tragic 40.4% |
| Blackfeet | 0.1 /100 | #277 | Tragic 40.3% |
| Ottawa | 0.1 /100 | #278 | Tragic 40.3% |
| Immigrants | Nicaragua | 0.1 /100 | #279 | Tragic 40.3% |
| Immigrants | Micronesia | 0.1 /100 | #280 | Tragic 40.2% |
| Immigrants | Portugal | 0.1 /100 | #281 | Tragic 40.1% |
| Bangladeshis | 0.1 /100 | #282 | Tragic 40.0% |
| Haitians | 0.1 /100 | #283 | Tragic 40.0% |
| Comanche | 0.1 /100 | #284 | Tragic 39.9% |
| Immigrants | Belize | 0.1 /100 | #285 | Tragic 39.9% |
| Immigrants | Caribbean | 0.0 /100 | #286 | Tragic 39.7% |
Demographics Similar to Russians by Associate's Degree
In terms of associate's degree, the demographic groups most similar to Russians are Bulgarian (53.3%, a difference of 0.060%), Israeli (53.4%, a difference of 0.26%), Immigrants from Russia (53.1%, a difference of 0.28%), Immigrants from Denmark (53.1%, a difference of 0.36%), and Immigrants from Turkey (53.4%, a difference of 0.38%).
| Demographics | Rating | Rank | Associate's Degree |
| Turks | 100.0 /100 | #28 | Exceptional 53.9% |
| Immigrants | France | 100.0 /100 | #29 | Exceptional 53.9% |
| Immigrants | Sri Lanka | 100.0 /100 | #30 | Exceptional 53.7% |
| Immigrants | Northern Europe | 100.0 /100 | #31 | Exceptional 53.5% |
| Immigrants | Turkey | 100.0 /100 | #32 | Exceptional 53.4% |
| Israelis | 100.0 /100 | #33 | Exceptional 53.4% |
| Bulgarians | 100.0 /100 | #34 | Exceptional 53.3% |
| Russians | 100.0 /100 | #35 | Exceptional 53.2% |
| Immigrants | Russia | 100.0 /100 | #36 | Exceptional 53.1% |
| Immigrants | Denmark | 100.0 /100 | #37 | Exceptional 53.1% |
| Mongolians | 100.0 /100 | #38 | Exceptional 53.0% |
| Immigrants | Belarus | 99.9 /100 | #39 | Exceptional 52.8% |
| Immigrants | Latvia | 99.9 /100 | #40 | Exceptional 52.8% |
| Immigrants | Saudi Arabia | 99.9 /100 | #41 | Exceptional 52.6% |
| Immigrants | Malaysia | 99.9 /100 | #42 | Exceptional 52.5% |