Ugandan vs Immigrants from Belarus In Labor Force | Age 45-54
COMPARE
Ugandan
Immigrants from Belarus
In Labor Force | Age 45-54
In Labor Force | Age 45-54 Comparison
Ugandans
Immigrants from Belarus
83.7%
IN LABOR FORCE | AGE 45-54
99.5/ 100
METRIC RATING
36th/ 347
METRIC RANK
83.3%
IN LABOR FORCE | AGE 45-54
94.1/ 100
METRIC RATING
101st/ 347
METRIC RANK
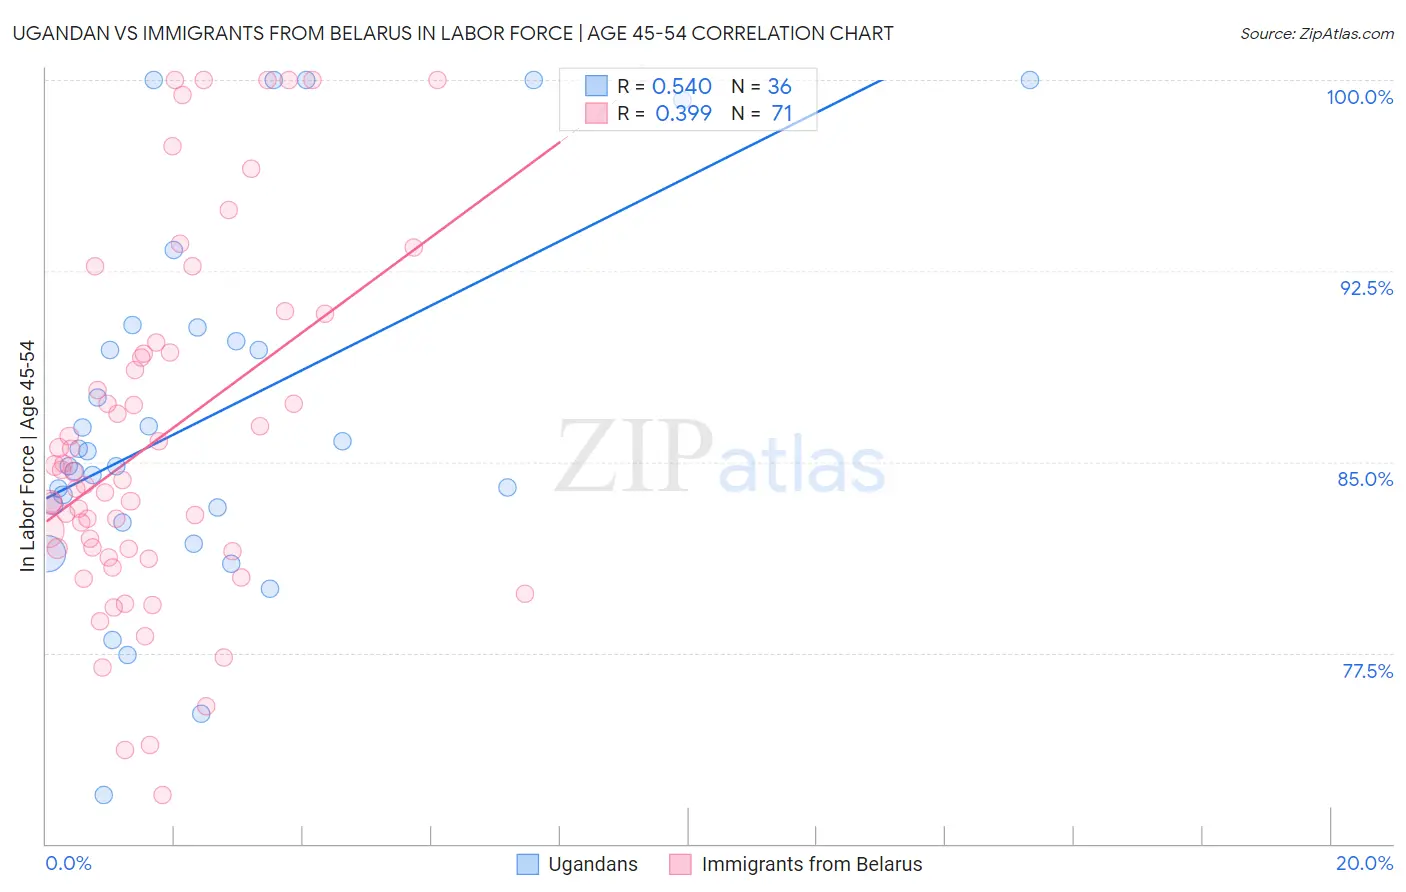
Ugandan vs Immigrants from Belarus In Labor Force | Age 45-54 Correlation Chart
The statistical analysis conducted on geographies consisting of 93,996,465 people shows a substantial positive correlation between the proportion of Ugandans and labor force participation rate among population between the ages 45 and 54 in the United States with a correlation coefficient (R) of 0.540 and weighted average of 83.7%. Similarly, the statistical analysis conducted on geographies consisting of 150,181,664 people shows a mild positive correlation between the proportion of Immigrants from Belarus and labor force participation rate among population between the ages 45 and 54 in the United States with a correlation coefficient (R) of 0.399 and weighted average of 83.3%, a difference of 0.54%.
In Labor Force | Age 45-54 Correlation Summary
| Measurement | Ugandan | Immigrants from Belarus |
| Minimum | 71.9% | 71.9% |
| Maximum | 100.0% | 100.0% |
| Range | 28.1% | 28.1% |
| Mean | 86.8% | 85.9% |
| Median | 85.1% | 84.3% |
| Interquartile 25% (IQ1) | 82.9% | 81.5% |
| Interquartile 75% (IQ3) | 90.0% | 89.3% |
| Interquartile Range (IQR) | 7.1% | 7.8% |
| Standard Deviation (Sample) | 7.3% | 6.9% |
| Standard Deviation (Population) | 7.2% | 6.9% |
Similar Demographics by In Labor Force | Age 45-54
Demographics Similar to Ugandans by In Labor Force | Age 45-54
In terms of in labor force | age 45-54, the demographic groups most similar to Ugandans are Kenyan (83.7%, a difference of 0.0%), Brazilian (83.7%, a difference of 0.0%), Swedish (83.7%, a difference of 0.020%), Immigrants from Venezuela (83.7%, a difference of 0.040%), and Immigrants from Cuba (83.7%, a difference of 0.040%).
| Demographics | Rating | Rank | In Labor Force | Age 45-54 |
| Immigrants | Pakistan | 99.7 /100 | #29 | Exceptional 83.8% |
| Immigrants | Bulgaria | 99.7 /100 | #30 | Exceptional 83.8% |
| Immigrants | Eritrea | 99.7 /100 | #31 | Exceptional 83.8% |
| Turks | 99.7 /100 | #32 | Exceptional 83.8% |
| Latvians | 99.7 /100 | #33 | Exceptional 83.8% |
| Kenyans | 99.5 /100 | #34 | Exceptional 83.7% |
| Brazilians | 99.5 /100 | #35 | Exceptional 83.7% |
| Ugandans | 99.5 /100 | #36 | Exceptional 83.7% |
| Swedes | 99.4 /100 | #37 | Exceptional 83.7% |
| Immigrants | Venezuela | 99.4 /100 | #38 | Exceptional 83.7% |
| Immigrants | Cuba | 99.4 /100 | #39 | Exceptional 83.7% |
| Immigrants | Uganda | 99.4 /100 | #40 | Exceptional 83.7% |
| Immigrants | Korea | 99.3 /100 | #41 | Exceptional 83.7% |
| Immigrants | Moldova | 99.3 /100 | #42 | Exceptional 83.7% |
| Venezuelans | 99.2 /100 | #43 | Exceptional 83.6% |
Demographics Similar to Immigrants from Belarus by In Labor Force | Age 45-54
In terms of in labor force | age 45-54, the demographic groups most similar to Immigrants from Belarus are Mongolian (83.3%, a difference of 0.0%), Maltese (83.3%, a difference of 0.010%), Immigrants from Middle Africa (83.3%, a difference of 0.010%), Immigrants from Singapore (83.3%, a difference of 0.010%), and Albanian (83.3%, a difference of 0.010%).
| Demographics | Rating | Rank | In Labor Force | Age 45-54 |
| Argentineans | 94.9 /100 | #94 | Exceptional 83.3% |
| Immigrants | Argentina | 94.9 /100 | #95 | Exceptional 83.3% |
| Immigrants | Kuwait | 94.8 /100 | #96 | Exceptional 83.3% |
| Palestinians | 94.8 /100 | #97 | Exceptional 83.3% |
| Maltese | 94.4 /100 | #98 | Exceptional 83.3% |
| Immigrants | Middle Africa | 94.3 /100 | #99 | Exceptional 83.3% |
| Mongolians | 94.2 /100 | #100 | Exceptional 83.3% |
| Immigrants | Belarus | 94.1 /100 | #101 | Exceptional 83.3% |
| Immigrants | Singapore | 93.9 /100 | #102 | Exceptional 83.3% |
| Albanians | 93.9 /100 | #103 | Exceptional 83.3% |
| Immigrants | Romania | 93.8 /100 | #104 | Exceptional 83.3% |
| Immigrants | South America | 93.5 /100 | #105 | Exceptional 83.2% |
| Sri Lankans | 93.2 /100 | #106 | Exceptional 83.2% |
| Iranians | 92.9 /100 | #107 | Exceptional 83.2% |
| Slovaks | 92.8 /100 | #108 | Exceptional 83.2% |