Immigrants from Nepal vs Immigrants from Haiti Seniors Poverty Over the Age of 75
COMPARE
Immigrants from Nepal
Immigrants from Haiti
Seniors Poverty Over the Age of 75
Seniors Poverty Over the Age of 75 Comparison
Immigrants from Nepal
Immigrants from Haiti
11.8%
SENIORS POVERTY OVER THE AGE OF 75
84.5/ 100
METRIC RATING
120th/ 347
METRIC RANK
16.5%
SENIORS POVERTY OVER THE AGE OF 75
0.0/ 100
METRIC RATING
321st/ 347
METRIC RANK
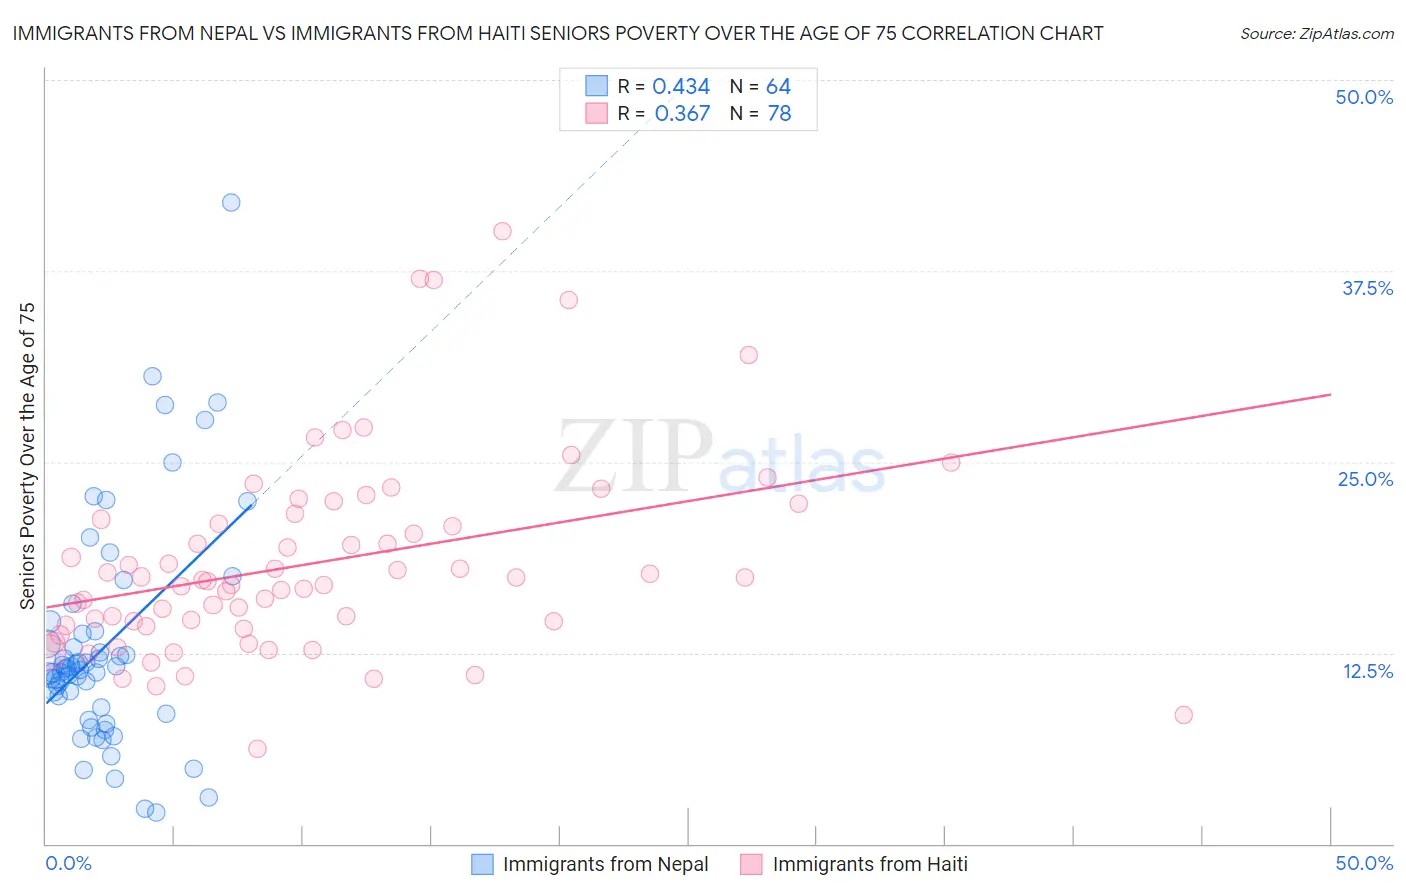
Immigrants from Nepal vs Immigrants from Haiti Seniors Poverty Over the Age of 75 Correlation Chart
The statistical analysis conducted on geographies consisting of 185,282,037 people shows a moderate positive correlation between the proportion of Immigrants from Nepal and poverty level among seniors over the age of 75 in the United States with a correlation coefficient (R) of 0.434 and weighted average of 11.8%. Similarly, the statistical analysis conducted on geographies consisting of 223,608,368 people shows a mild positive correlation between the proportion of Immigrants from Haiti and poverty level among seniors over the age of 75 in the United States with a correlation coefficient (R) of 0.367 and weighted average of 16.5%, a difference of 40.4%.
Seniors Poverty Over the Age of 75 Correlation Summary
| Measurement | Immigrants from Nepal | Immigrants from Haiti |
| Minimum | 2.1% | 6.2% |
| Maximum | 42.0% | 40.1% |
| Range | 39.9% | 33.9% |
| Mean | 12.9% | 18.4% |
| Median | 11.4% | 17.2% |
| Interquartile 25% (IQ1) | 8.7% | 14.3% |
| Interquartile 75% (IQ3) | 13.8% | 21.2% |
| Interquartile Range (IQR) | 5.1% | 6.9% |
| Standard Deviation (Sample) | 7.4% | 6.5% |
| Standard Deviation (Population) | 7.3% | 6.4% |
Similar Demographics by Seniors Poverty Over the Age of 75
Demographics Similar to Immigrants from Nepal by Seniors Poverty Over the Age of 75
In terms of seniors poverty over the age of 75, the demographic groups most similar to Immigrants from Nepal are Immigrants from Uganda (11.8%, a difference of 0.040%), Malaysian (11.8%, a difference of 0.080%), Pakistani (11.8%, a difference of 0.080%), Immigrants from Italy (11.8%, a difference of 0.090%), and Fijian (11.8%, a difference of 0.12%).
| Demographics | Rating | Rank | Seniors Poverty Over the Age of 75 |
| Immigrants | Czechoslovakia | 87.0 /100 | #113 | Excellent 11.7% |
| Ukrainians | 86.9 /100 | #114 | Excellent 11.7% |
| New Zealanders | 86.3 /100 | #115 | Excellent 11.7% |
| Iraqis | 86.3 /100 | #116 | Excellent 11.7% |
| Icelanders | 85.7 /100 | #117 | Excellent 11.7% |
| Immigrants | Zimbabwe | 85.5 /100 | #118 | Excellent 11.7% |
| Immigrants | Uganda | 84.8 /100 | #119 | Excellent 11.8% |
| Immigrants | Nepal | 84.5 /100 | #120 | Excellent 11.8% |
| Malaysians | 84.1 /100 | #121 | Excellent 11.8% |
| Pakistanis | 84.0 /100 | #122 | Excellent 11.8% |
| Immigrants | Italy | 84.0 /100 | #123 | Excellent 11.8% |
| Fijians | 83.8 /100 | #124 | Excellent 11.8% |
| Sudanese | 83.6 /100 | #125 | Excellent 11.8% |
| Pennsylvania Germans | 83.4 /100 | #126 | Excellent 11.8% |
| Immigrants | Denmark | 82.6 /100 | #127 | Excellent 11.8% |
Demographics Similar to Immigrants from Haiti by Seniors Poverty Over the Age of 75
In terms of seniors poverty over the age of 75, the demographic groups most similar to Immigrants from Haiti are Immigrants from Barbados (16.5%, a difference of 0.020%), Central American Indian (16.5%, a difference of 0.11%), Immigrants from Uzbekistan (16.5%, a difference of 0.16%), Immigrants from Yemen (16.5%, a difference of 0.18%), and Nicaraguan (16.6%, a difference of 0.55%).
| Demographics | Rating | Rank | Seniors Poverty Over the Age of 75 |
| Tsimshian | 0.0 /100 | #314 | Tragic 16.1% |
| Guyanese | 0.0 /100 | #315 | Tragic 16.1% |
| Immigrants | Ecuador | 0.0 /100 | #316 | Tragic 16.1% |
| Immigrants | Guyana | 0.0 /100 | #317 | Tragic 16.2% |
| Houma | 0.0 /100 | #318 | Tragic 16.2% |
| Haitians | 0.0 /100 | #319 | Tragic 16.2% |
| Immigrants | Yemen | 0.0 /100 | #320 | Tragic 16.5% |
| Immigrants | Haiti | 0.0 /100 | #321 | Tragic 16.5% |
| Immigrants | Barbados | 0.0 /100 | #322 | Tragic 16.5% |
| Central American Indians | 0.0 /100 | #323 | Tragic 16.5% |
| Immigrants | Uzbekistan | 0.0 /100 | #324 | Tragic 16.5% |
| Nicaraguans | 0.0 /100 | #325 | Tragic 16.6% |
| Pueblo | 0.0 /100 | #326 | Tragic 16.7% |
| Sioux | 0.0 /100 | #327 | Tragic 16.8% |
| Cape Verdeans | 0.0 /100 | #328 | Tragic 16.8% |