Immigrants from Sierra Leone vs Paiute In Labor Force | Age 20-24
COMPARE
Immigrants from Sierra Leone
Paiute
In Labor Force | Age 20-24
In Labor Force | Age 20-24 Comparison
Immigrants from Sierra Leone
Paiute
75.8%
IN LABOR FORCE | AGE 20-24
93.8/ 100
METRIC RATING
124th/ 347
METRIC RANK
75.3%
IN LABOR FORCE | AGE 20-24
74.1/ 100
METRIC RATING
151st/ 347
METRIC RANK
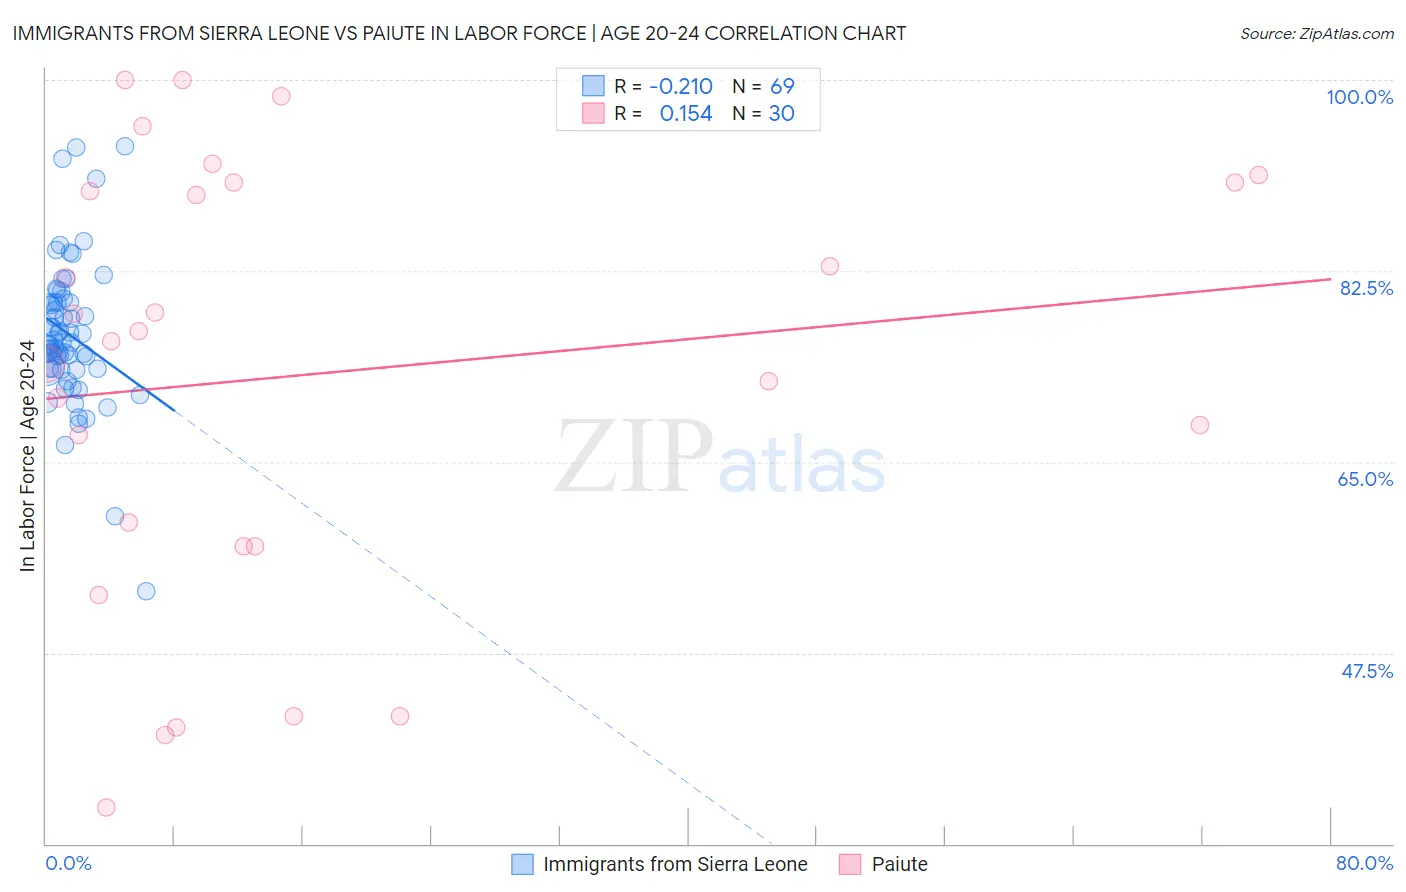
Immigrants from Sierra Leone vs Paiute In Labor Force | Age 20-24 Correlation Chart
The statistical analysis conducted on geographies consisting of 101,648,861 people shows a weak negative correlation between the proportion of Immigrants from Sierra Leone and labor force participation rate among population between the ages 20 and 24 in the United States with a correlation coefficient (R) of -0.210 and weighted average of 75.8%. Similarly, the statistical analysis conducted on geographies consisting of 58,387,472 people shows a poor positive correlation between the proportion of Paiute and labor force participation rate among population between the ages 20 and 24 in the United States with a correlation coefficient (R) of 0.154 and weighted average of 75.3%, a difference of 0.61%.
In Labor Force | Age 20-24 Correlation Summary
| Measurement | Immigrants from Sierra Leone | Paiute |
| Minimum | 53.1% | 33.3% |
| Maximum | 93.9% | 100.0% |
| Range | 40.8% | 66.7% |
| Mean | 76.7% | 73.0% |
| Median | 75.9% | 76.5% |
| Interquartile 25% (IQ1) | 73.5% | 57.3% |
| Interquartile 75% (IQ3) | 79.6% | 90.6% |
| Interquartile Range (IQR) | 6.1% | 33.3% |
| Standard Deviation (Sample) | 6.7% | 20.0% |
| Standard Deviation (Population) | 6.6% | 19.7% |
Similar Demographics by In Labor Force | Age 20-24
Demographics Similar to Immigrants from Sierra Leone by In Labor Force | Age 20-24
In terms of in labor force | age 20-24, the demographic groups most similar to Immigrants from Sierra Leone are Immigrants from Scotland (75.8%, a difference of 0.010%), Pakistani (75.8%, a difference of 0.020%), Immigrants from Bulgaria (75.8%, a difference of 0.020%), Immigrants from Serbia (75.8%, a difference of 0.030%), and Immigrants from Africa (75.8%, a difference of 0.050%).
| Demographics | Rating | Rank | In Labor Force | Age 20-24 |
| Assyrians/Chaldeans/Syriacs | 94.9 /100 | #117 | Exceptional 75.9% |
| Spanish Americans | 94.8 /100 | #118 | Exceptional 75.8% |
| Immigrants | Portugal | 94.8 /100 | #119 | Exceptional 75.8% |
| Immigrants | Africa | 94.6 /100 | #120 | Exceptional 75.8% |
| Immigrants | Serbia | 94.3 /100 | #121 | Exceptional 75.8% |
| Pakistanis | 94.1 /100 | #122 | Exceptional 75.8% |
| Immigrants | Bulgaria | 94.1 /100 | #123 | Exceptional 75.8% |
| Immigrants | Sierra Leone | 93.8 /100 | #124 | Exceptional 75.8% |
| Immigrants | Scotland | 93.7 /100 | #125 | Exceptional 75.8% |
| Brazilians | 93.0 /100 | #126 | Exceptional 75.8% |
| Sub-Saharan Africans | 90.9 /100 | #127 | Exceptional 75.7% |
| Immigrants | Afghanistan | 89.4 /100 | #128 | Excellent 75.6% |
| Iroquois | 89.1 /100 | #129 | Excellent 75.6% |
| Immigrants | Austria | 88.8 /100 | #130 | Excellent 75.6% |
| Immigrants | Jordan | 88.5 /100 | #131 | Excellent 75.6% |
Demographics Similar to Paiute by In Labor Force | Age 20-24
In terms of in labor force | age 20-24, the demographic groups most similar to Paiute are Salvadoran (75.3%, a difference of 0.010%), Lebanese (75.3%, a difference of 0.010%), Guatemalan (75.3%, a difference of 0.030%), Osage (75.3%, a difference of 0.030%), and Ugandan (75.4%, a difference of 0.040%).
| Demographics | Rating | Rank | In Labor Force | Age 20-24 |
| Bhutanese | 80.8 /100 | #144 | Excellent 75.4% |
| Koreans | 79.7 /100 | #145 | Good 75.4% |
| Mexican American Indians | 78.8 /100 | #146 | Good 75.4% |
| Comanche | 77.6 /100 | #147 | Good 75.4% |
| Immigrants | Cambodia | 76.7 /100 | #148 | Good 75.4% |
| Ugandans | 76.1 /100 | #149 | Good 75.4% |
| Salvadorans | 74.8 /100 | #150 | Good 75.3% |
| Paiute | 74.1 /100 | #151 | Good 75.3% |
| Lebanese | 73.5 /100 | #152 | Good 75.3% |
| Guatemalans | 72.3 /100 | #153 | Good 75.3% |
| Osage | 72.3 /100 | #154 | Good 75.3% |
| Immigrants | Guatemala | 71.9 /100 | #155 | Good 75.3% |
| Immigrants | El Salvador | 71.7 /100 | #156 | Good 75.3% |
| Immigrants | Western Europe | 71.5 /100 | #157 | Good 75.3% |
| Immigrants | Bolivia | 71.0 /100 | #158 | Good 75.3% |