Immigrants from Morocco vs Immigrants from Northern Europe Householder Income Ages 25 - 44 years
COMPARE
Immigrants from Morocco
Immigrants from Northern Europe
Householder Income Ages 25 - 44 years
Householder Income Ages 25 - 44 years Comparison
Immigrants from Morocco
Immigrants from Northern Europe
$97,305
HOUSEHOLDER INCOME AGES 25 - 44 YEARS
82.0/ 100
METRIC RATING
140th/ 347
METRIC RANK
$111,676
HOUSEHOLDER INCOME AGES 25 - 44 YEARS
100.0/ 100
METRIC RATING
25th/ 347
METRIC RANK
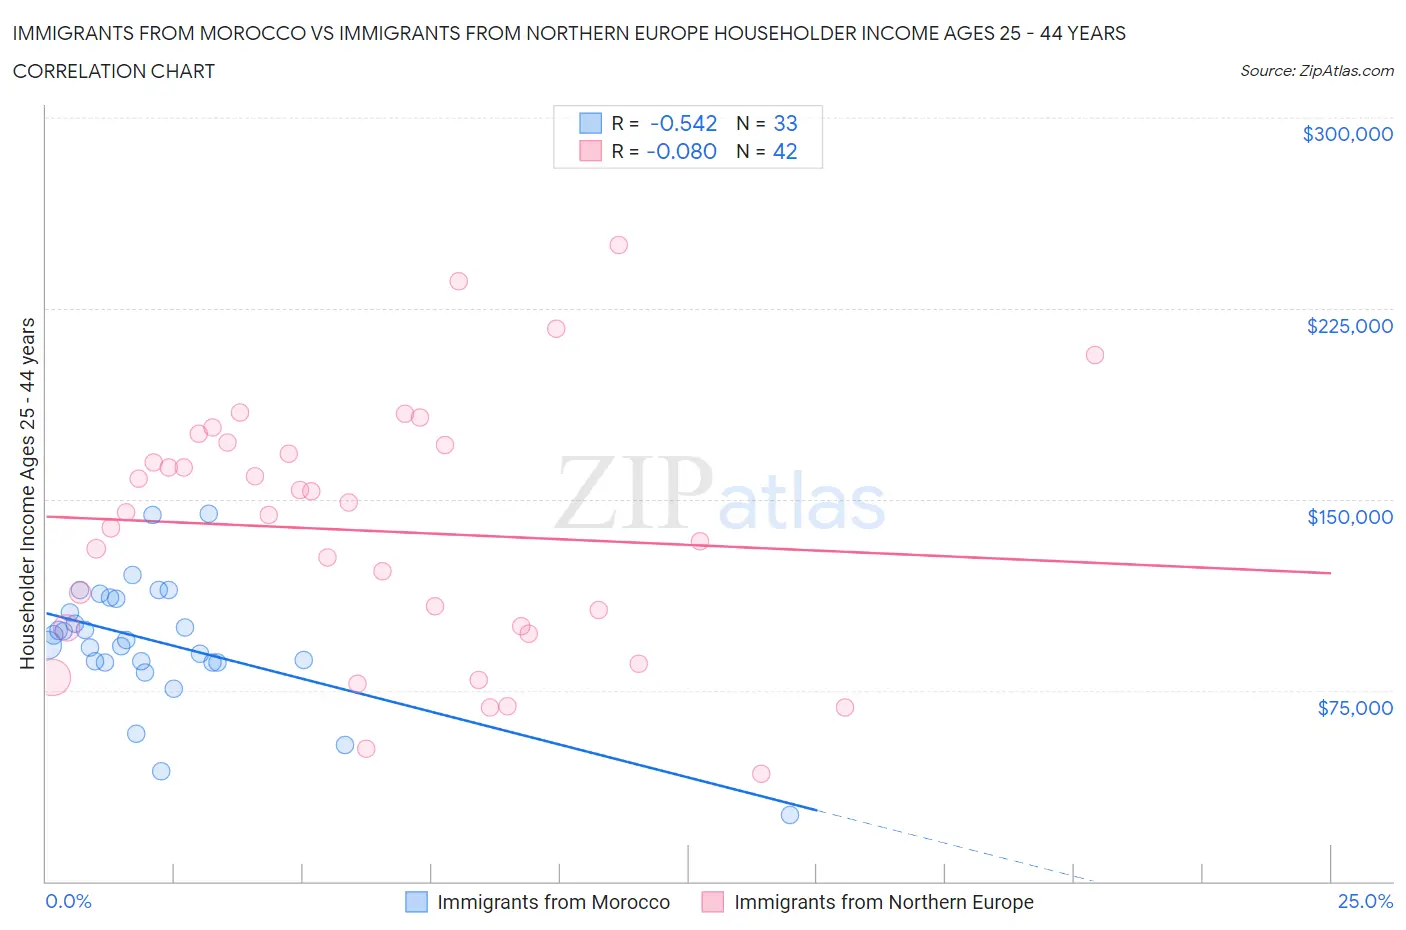
Immigrants from Morocco vs Immigrants from Northern Europe Householder Income Ages 25 - 44 years Correlation Chart
The statistical analysis conducted on geographies consisting of 178,797,729 people shows a substantial negative correlation between the proportion of Immigrants from Morocco and household income with householder between the ages 25 and 44 in the United States with a correlation coefficient (R) of -0.542 and weighted average of $97,305. Similarly, the statistical analysis conducted on geographies consisting of 475,162,108 people shows a slight negative correlation between the proportion of Immigrants from Northern Europe and household income with householder between the ages 25 and 44 in the United States with a correlation coefficient (R) of -0.080 and weighted average of $111,676, a difference of 14.8%.
Householder Income Ages 25 - 44 years Correlation Summary
| Measurement | Immigrants from Morocco | Immigrants from Northern Europe |
| Minimum | $26,250 | $42,036 |
| Maximum | $144,345 | $250,001 |
| Range | $118,095 | $207,965 |
| Mean | $93,983 | $137,540 |
| Median | $94,739 | $144,261 |
| Interquartile 25% (IQ1) | $85,878 | $99,498 |
| Interquartile 75% (IQ3) | $111,008 | $171,539 |
| Interquartile Range (IQR) | $25,131 | $72,041 |
| Standard Deviation (Sample) | $24,483 | $49,597 |
| Standard Deviation (Population) | $24,109 | $49,003 |
Similar Demographics by Householder Income Ages 25 - 44 years
Demographics Similar to Immigrants from Morocco by Householder Income Ages 25 - 44 years
In terms of householder income ages 25 - 44 years, the demographic groups most similar to Immigrants from Morocco are Immigrants from Peru ($97,329, a difference of 0.020%), Lebanese ($97,339, a difference of 0.030%), Arab ($97,336, a difference of 0.030%), Luxembourger ($97,237, a difference of 0.070%), and Danish ($97,221, a difference of 0.090%).
| Demographics | Rating | Rank | Householder Income Ages 25 - 44 years |
| Tsimshian | 85.8 /100 | #133 | Excellent $97,809 |
| Canadians | 84.5 /100 | #134 | Excellent $97,625 |
| Immigrants | Oceania | 84.5 /100 | #135 | Excellent $97,623 |
| Hungarians | 83.9 /100 | #136 | Excellent $97,544 |
| Lebanese | 82.3 /100 | #137 | Excellent $97,339 |
| Arabs | 82.3 /100 | #138 | Excellent $97,336 |
| Immigrants | Peru | 82.2 /100 | #139 | Excellent $97,329 |
| Immigrants | Morocco | 82.0 /100 | #140 | Excellent $97,305 |
| Luxembourgers | 81.5 /100 | #141 | Excellent $97,237 |
| Danes | 81.3 /100 | #142 | Excellent $97,221 |
| Immigrants | Jordan | 81.0 /100 | #143 | Excellent $97,185 |
| Immigrants | Chile | 80.8 /100 | #144 | Excellent $97,159 |
| Norwegians | 78.2 /100 | #145 | Good $96,866 |
| Ethiopians | 77.8 /100 | #146 | Good $96,824 |
| Immigrants | Syria | 77.4 /100 | #147 | Good $96,789 |
Demographics Similar to Immigrants from Northern Europe by Householder Income Ages 25 - 44 years
In terms of householder income ages 25 - 44 years, the demographic groups most similar to Immigrants from Northern Europe are Immigrants from Sweden ($112,010, a difference of 0.30%), Immigrants from Japan ($112,228, a difference of 0.49%), Immigrants from Belgium ($112,575, a difference of 0.80%), Immigrants from Asia ($110,787, a difference of 0.80%), and Asian ($112,666, a difference of 0.89%).
| Demographics | Rating | Rank | Householder Income Ages 25 - 44 years |
| Eastern Europeans | 100.0 /100 | #18 | Exceptional $114,523 |
| Burmese | 100.0 /100 | #19 | Exceptional $113,701 |
| Immigrants | Korea | 100.0 /100 | #20 | Exceptional $113,401 |
| Asians | 100.0 /100 | #21 | Exceptional $112,666 |
| Immigrants | Belgium | 100.0 /100 | #22 | Exceptional $112,575 |
| Immigrants | Japan | 100.0 /100 | #23 | Exceptional $112,228 |
| Immigrants | Sweden | 100.0 /100 | #24 | Exceptional $112,010 |
| Immigrants | Northern Europe | 100.0 /100 | #25 | Exceptional $111,676 |
| Immigrants | Asia | 100.0 /100 | #26 | Exceptional $110,787 |
| Russians | 100.0 /100 | #27 | Exceptional $110,398 |
| Immigrants | Denmark | 100.0 /100 | #28 | Exceptional $110,363 |
| Turks | 100.0 /100 | #29 | Exceptional $110,318 |
| Immigrants | Greece | 100.0 /100 | #30 | Exceptional $110,103 |
| Maltese | 100.0 /100 | #31 | Exceptional $110,064 |
| Immigrants | Sri Lanka | 100.0 /100 | #32 | Exceptional $109,741 |