Serbian vs Hungarian In Labor Force | Age 20-24
COMPARE
Serbian
Hungarian
In Labor Force | Age 20-24
In Labor Force | Age 20-24 Comparison
Serbians
Hungarians
77.3%
IN LABOR FORCE | AGE 20-24
100.0/ 100
METRIC RATING
48th/ 347
METRIC RANK
76.3%
IN LABOR FORCE | AGE 20-24
98.9/ 100
METRIC RATING
93rd/ 347
METRIC RANK
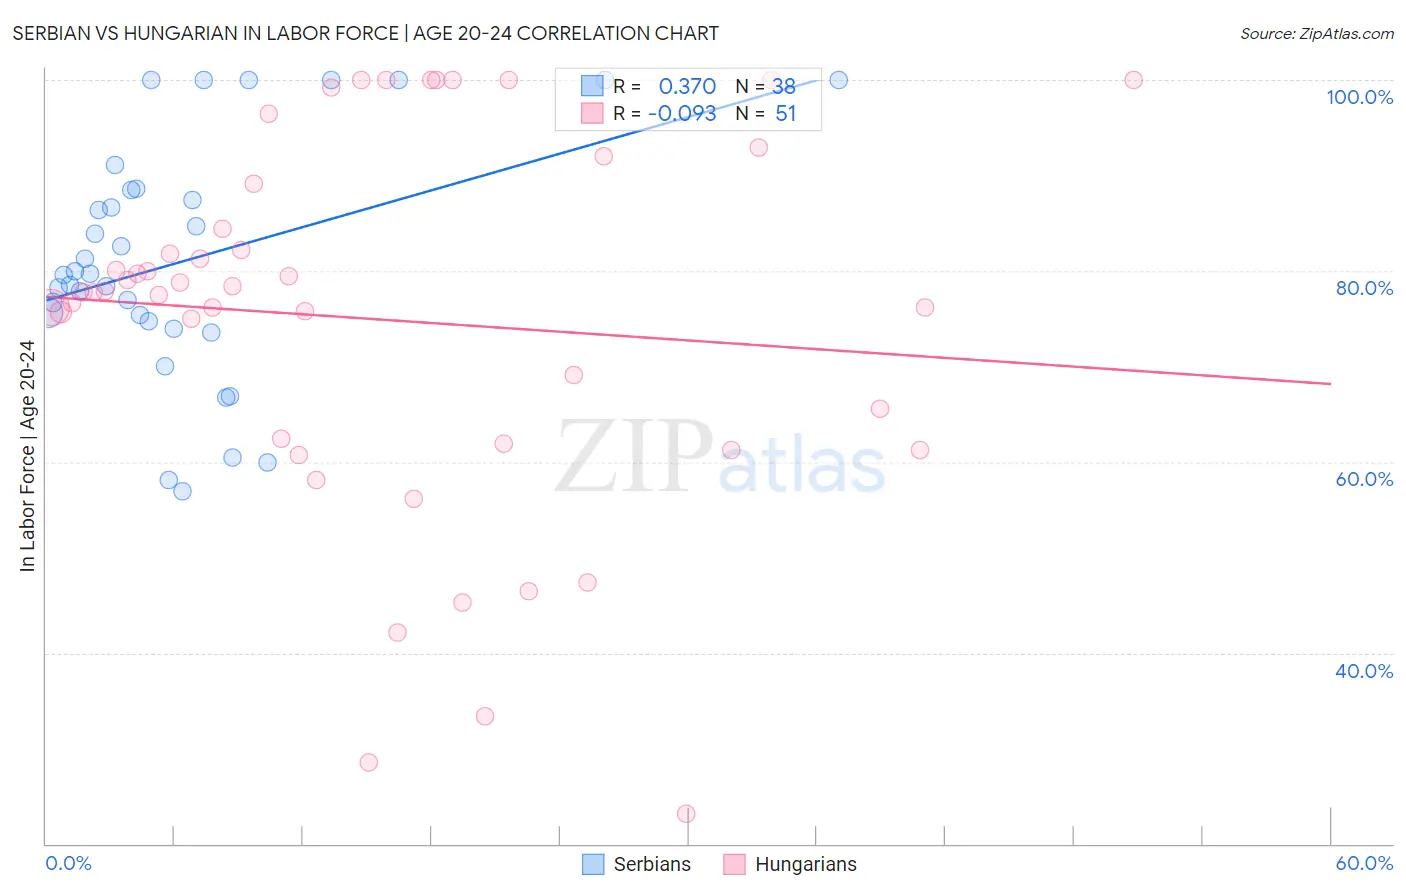
Serbian vs Hungarian In Labor Force | Age 20-24 Correlation Chart
The statistical analysis conducted on geographies consisting of 267,532,940 people shows a mild positive correlation between the proportion of Serbians and labor force participation rate among population between the ages 20 and 24 in the United States with a correlation coefficient (R) of 0.370 and weighted average of 77.3%. Similarly, the statistical analysis conducted on geographies consisting of 485,725,263 people shows a slight negative correlation between the proportion of Hungarians and labor force participation rate among population between the ages 20 and 24 in the United States with a correlation coefficient (R) of -0.093 and weighted average of 76.3%, a difference of 1.3%.
In Labor Force | Age 20-24 Correlation Summary
| Measurement | Serbian | Hungarian |
| Minimum | 56.9% | 23.1% |
| Maximum | 100.0% | 100.0% |
| Range | 43.1% | 76.9% |
| Mean | 81.0% | 74.9% |
| Median | 79.6% | 77.8% |
| Interquartile 25% (IQ1) | 74.7% | 61.9% |
| Interquartile 75% (IQ3) | 88.5% | 89.1% |
| Interquartile Range (IQR) | 13.7% | 27.2% |
| Standard Deviation (Sample) | 12.3% | 19.5% |
| Standard Deviation (Population) | 12.2% | 19.3% |
Similar Demographics by In Labor Force | Age 20-24
Demographics Similar to Serbians by In Labor Force | Age 20-24
In terms of in labor force | age 20-24, the demographic groups most similar to Serbians are Chinese (77.3%, a difference of 0.010%), Ethiopian (77.3%, a difference of 0.050%), Malaysian (77.2%, a difference of 0.050%), Croatian (77.2%, a difference of 0.060%), and Indonesian (77.2%, a difference of 0.060%).
| Demographics | Rating | Rank | In Labor Force | Age 20-24 |
| Immigrants | Congo | 100.0 /100 | #41 | Exceptional 77.4% |
| French | 100.0 /100 | #42 | Exceptional 77.4% |
| Immigrants | Laos | 100.0 /100 | #43 | Exceptional 77.4% |
| Fijians | 100.0 /100 | #44 | Exceptional 77.4% |
| Native Hawaiians | 100.0 /100 | #45 | Exceptional 77.4% |
| Samoans | 100.0 /100 | #46 | Exceptional 77.4% |
| Ethiopians | 100.0 /100 | #47 | Exceptional 77.3% |
| Serbians | 100.0 /100 | #48 | Exceptional 77.3% |
| Chinese | 100.0 /100 | #49 | Exceptional 77.3% |
| Malaysians | 100.0 /100 | #50 | Exceptional 77.2% |
| Croatians | 100.0 /100 | #51 | Exceptional 77.2% |
| Indonesians | 100.0 /100 | #52 | Exceptional 77.2% |
| Immigrants | Azores | 100.0 /100 | #53 | Exceptional 77.2% |
| Celtics | 99.9 /100 | #54 | Exceptional 77.1% |
| Immigrants | Liberia | 99.9 /100 | #55 | Exceptional 77.1% |
Demographics Similar to Hungarians by In Labor Force | Age 20-24
In terms of in labor force | age 20-24, the demographic groups most similar to Hungarians are Maltese (76.3%, a difference of 0.020%), Sierra Leonean (76.3%, a difference of 0.050%), Immigrants from Burma/Myanmar (76.3%, a difference of 0.070%), Potawatomi (76.2%, a difference of 0.090%), and Immigrants from Germany (76.2%, a difference of 0.10%).
| Demographics | Rating | Rank | In Labor Force | Age 20-24 |
| Immigrants | Iraq | 99.3 /100 | #86 | Exceptional 76.4% |
| Immigrants | Thailand | 99.3 /100 | #87 | Exceptional 76.4% |
| Spanish | 99.2 /100 | #88 | Exceptional 76.4% |
| Bulgarians | 99.2 /100 | #89 | Exceptional 76.4% |
| Immigrants | Burma/Myanmar | 99.1 /100 | #90 | Exceptional 76.3% |
| Sierra Leoneans | 99.0 /100 | #91 | Exceptional 76.3% |
| Maltese | 98.9 /100 | #92 | Exceptional 76.3% |
| Hungarians | 98.9 /100 | #93 | Exceptional 76.3% |
| Potawatomi | 98.5 /100 | #94 | Exceptional 76.2% |
| Immigrants | Germany | 98.5 /100 | #95 | Exceptional 76.2% |
| Immigrants | Nonimmigrants | 98.5 /100 | #96 | Exceptional 76.2% |
| Immigrants | Lithuania | 98.0 /100 | #97 | Exceptional 76.1% |
| Immigrants | Oceania | 98.0 /100 | #98 | Exceptional 76.1% |
| Americans | 97.8 /100 | #99 | Exceptional 76.1% |
| Shoshone | 97.8 /100 | #100 | Exceptional 76.1% |