Immigrants from Moldova vs Immigrants from Haiti In Labor Force | Age > 16
COMPARE
Immigrants from Moldova
Immigrants from Haiti
In Labor Force | Age > 16
In Labor Force | Age > 16 Comparison
Immigrants from Moldova
Immigrants from Haiti
66.1%
IN LABOR FORCE | AGE > 16
99.6/ 100
METRIC RATING
77th/ 347
METRIC RANK
65.1%
IN LABOR FORCE | AGE > 16
43.3/ 100
METRIC RATING
179th/ 347
METRIC RANK
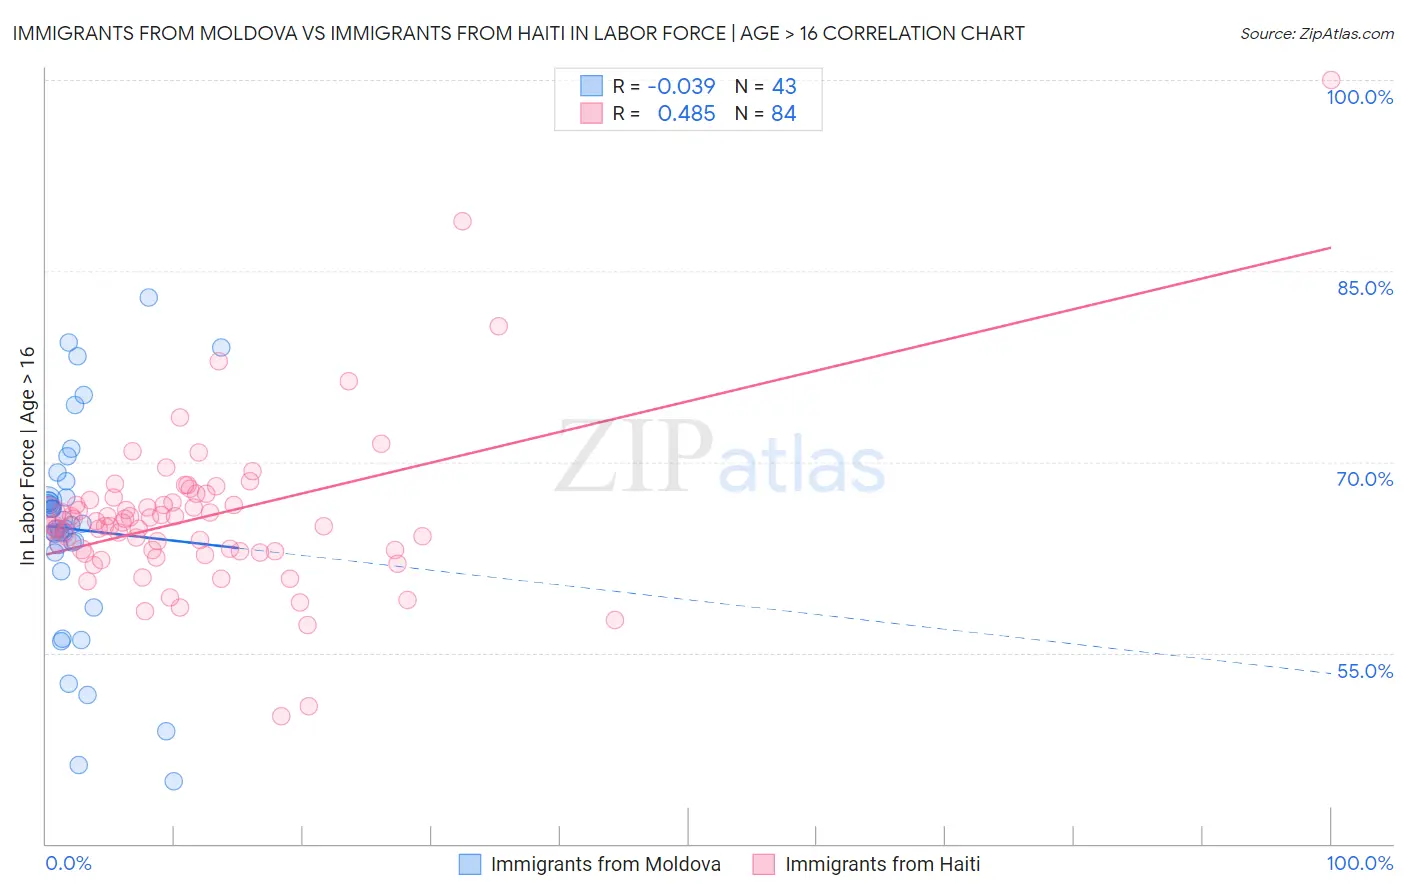
Immigrants from Moldova vs Immigrants from Haiti In Labor Force | Age > 16 Correlation Chart
The statistical analysis conducted on geographies consisting of 124,396,989 people shows no correlation between the proportion of Immigrants from Moldova and labor force participation rate among population ages 16 and over in the United States with a correlation coefficient (R) of -0.039 and weighted average of 66.1%. Similarly, the statistical analysis conducted on geographies consisting of 225,285,976 people shows a moderate positive correlation between the proportion of Immigrants from Haiti and labor force participation rate among population ages 16 and over in the United States with a correlation coefficient (R) of 0.485 and weighted average of 65.1%, a difference of 1.6%.
In Labor Force | Age > 16 Correlation Summary
| Measurement | Immigrants from Moldova | Immigrants from Haiti |
| Minimum | 44.9% | 50.0% |
| Maximum | 82.9% | 100.0% |
| Range | 38.0% | 50.0% |
| Mean | 64.7% | 65.6% |
| Median | 65.1% | 65.1% |
| Interquartile 25% (IQ1) | 62.9% | 63.0% |
| Interquartile 75% (IQ3) | 67.2% | 66.9% |
| Interquartile Range (IQR) | 4.3% | 3.9% |
| Standard Deviation (Sample) | 8.3% | 6.5% |
| Standard Deviation (Population) | 8.2% | 6.5% |
Similar Demographics by In Labor Force | Age > 16
Demographics Similar to Immigrants from Moldova by In Labor Force | Age > 16
In terms of in labor force | age > 16, the demographic groups most similar to Immigrants from Moldova are Immigrants from Asia (66.1%, a difference of 0.0%), Immigrants from Malaysia (66.1%, a difference of 0.010%), Turkish (66.1%, a difference of 0.030%), Malaysian (66.1%, a difference of 0.040%), and Immigrants from Singapore (66.2%, a difference of 0.060%).
| Demographics | Rating | Rank | In Labor Force | Age > 16 |
| Asians | 99.7 /100 | #70 | Exceptional 66.2% |
| Burmese | 99.7 /100 | #71 | Exceptional 66.2% |
| Taiwanese | 99.7 /100 | #72 | Exceptional 66.2% |
| Immigrants | Vietnam | 99.7 /100 | #73 | Exceptional 66.2% |
| Immigrants | Korea | 99.7 /100 | #74 | Exceptional 66.2% |
| Immigrants | Singapore | 99.7 /100 | #75 | Exceptional 66.2% |
| Immigrants | Malaysia | 99.6 /100 | #76 | Exceptional 66.1% |
| Immigrants | Moldova | 99.6 /100 | #77 | Exceptional 66.1% |
| Immigrants | Asia | 99.6 /100 | #78 | Exceptional 66.1% |
| Turks | 99.6 /100 | #79 | Exceptional 66.1% |
| Malaysians | 99.6 /100 | #80 | Exceptional 66.1% |
| Moroccans | 99.5 /100 | #81 | Exceptional 66.1% |
| German Russians | 99.4 /100 | #82 | Exceptional 66.1% |
| Immigrants | Jordan | 99.4 /100 | #83 | Exceptional 66.1% |
| Central Americans | 99.4 /100 | #84 | Exceptional 66.1% |
Demographics Similar to Immigrants from Haiti by In Labor Force | Age > 16
In terms of in labor force | age > 16, the demographic groups most similar to Immigrants from Haiti are Immigrants from Latvia (65.1%, a difference of 0.0%), Immigrants from Panama (65.1%, a difference of 0.010%), Trinidadian and Tobagonian (65.1%, a difference of 0.020%), Eastern European (65.1%, a difference of 0.030%), and Immigrants from Nicaragua (65.1%, a difference of 0.030%).
| Demographics | Rating | Rank | In Labor Force | Age > 16 |
| Immigrants | Sweden | 61.3 /100 | #172 | Good 65.2% |
| Immigrants | Ukraine | 53.7 /100 | #173 | Average 65.1% |
| Macedonians | 50.0 /100 | #174 | Average 65.1% |
| Nicaraguans | 49.7 /100 | #175 | Average 65.1% |
| Swedes | 47.4 /100 | #176 | Average 65.1% |
| Eastern Europeans | 46.2 /100 | #177 | Average 65.1% |
| Trinidadians and Tobagonians | 45.2 /100 | #178 | Average 65.1% |
| Immigrants | Haiti | 43.3 /100 | #179 | Average 65.1% |
| Immigrants | Latvia | 42.9 /100 | #180 | Average 65.1% |
| Immigrants | Panama | 42.4 /100 | #181 | Average 65.1% |
| Immigrants | Nicaragua | 41.1 /100 | #182 | Average 65.1% |
| Soviet Union | 40.5 /100 | #183 | Average 65.0% |
| Carpatho Rusyns | 40.0 /100 | #184 | Average 65.0% |
| Syrians | 40.0 /100 | #185 | Average 65.0% |
| Immigrants | Switzerland | 38.2 /100 | #186 | Fair 65.0% |