Immigrants from Colombia vs Immigrants In Labor Force | Age 45-54

COMPARE

Immigrants from Colombia
Race
Ancestry
AfghanAfricanAlaska NativeAlaskan AthabascanAlbanianAleutAlsatianAmericanApacheArabArapahoArgentineanArmenianAssyrian/Chaldean/SyriacAustralianAustrianBahamianBangladeshiBarbadianBasqueBelgianBelizeanBermudanBhutaneseBlackfeetBolivianBrazilianBritishBritish West IndianBulgarianBurmeseCajunCambodianCanadianCape VerdeanCarpatho RusynCelticCentral AmericanCentral American IndianCherokeeCheyenneChickasawChileanChineseChippewaChoctawColombianColvilleComancheCosta RicanCreeCreekCroatianCrowCubanCypriotCzechCzechoslovakianDanishDelawareDominicanDutchDutch West IndianEastern EuropeanEcuadorianEgyptianEnglishEstonianEthiopianEuropeanFijianFilipinoFinnishFrenchFrench American IndianFrench CanadianGermanGerman RussianGhanaianGreekGuamanian/ChamorroGuatemalanGuyaneseHaitianHmongHonduranHopiHoumaHungarianIcelanderIndian (Asian)IndonesianInupiatIranianIraqiIrishIroquoisIsraeliItalianJamaicanJapaneseJordanianKenyanKiowaKoreanLaotianLatvianLebaneseLiberianLithuanianLumbeeLuxembourgerMacedonianMalaysianMalteseMarshalleseMenomineeMexicanMexican American IndianMongolianMoroccanNative HawaiianNavajoNepaleseNew ZealanderNicaraguanNigerianNorthern EuropeanNorwegianOkinawanOsageOttawaPaiutePakistaniPalestinianPanamanianParaguayanPennsylvania GermanPeruvianPimaPolishPortuguesePotawatomiPuebloPuerto RicanPuget Sound SalishRomanianRussianSalvadoranSamoanScandinavianScotch-IrishScottishSeminoleSenegaleseSerbianShoshoneSierra LeoneanSiouxSlavicSlovakSloveneSomaliSouth AfricanSouth AmericanSouth American IndianSoviet UnionSpaniardSpanishSpanish AmericanSpanish American IndianSri LankanSubsaharan AfricanSudaneseSwedishSwissSyrianTaiwaneseThaiTlingit-HaidaTohono O'OdhamTonganTrinidadian and TobagonianTsimshianTurkishU.S. Virgin IslanderUgandanUkrainianUruguayanUteVenezuelanVietnameseWelshWest IndianYakamaYaquiYugoslavianYumanYup'ikZimbabwean
Immigration
NonimmigrantsAfghanistanAfricaAlbaniaArgentinaArmeniaAsiaAustraliaAustriaBahamasBangladeshBarbadosBelarusBelgiumBelizeBoliviaBosnia and HerzegovinaBrazilBulgariaBurma/MyanmarCabo VerdeCambodiaCameroonCanadaCaribbeanCentral AmericaChileChinaColombiaCongoCosta RicaCroatiaCubaCzechoslovakiaDenmarkDominicaDominican RepublicEastern AfricaEastern AsiaEastern EuropeEcuadorEgyptEl SalvadorEnglandEritreaEthiopiaEuropeFijiFranceGermanyGhanaGreeceGrenadaGuatemalaGuyanaHaitiHondurasHong KongHungaryIndiaIndonesiaIranIraqIrelandIsraelItalyJamaicaJapanJordanKazakhstanKenyaKoreaKuwaitLaosLatin AmericaLatviaLebanonLiberiaLithuaniaMalaysiaMexicoMicronesiaMiddle AfricaMoldovaMoroccoNepalNetherlandsNicaraguaNigeriaNorth AmericaNorth MacedoniaNorthern AfricaNorthern EuropeNorwayOceaniaPakistanPanamaPeruPhilippinesPolandPortugalRomaniaRussiaSaudi ArabiaScotlandSenegalSerbiaSierra LeoneSingaporeSomaliaSouth AfricaSouth AmericaSouth Central AsiaSouth Eastern AsiaSouthern EuropeSpainSri LankaSt. Vincent and the GrenadinesSudanSwedenSwitzerlandSyriaTaiwanThailandTrinidad and TobagoTurkeyUgandaUkraineUruguayUzbekistanVenezuelaVietnamWest IndiesWestern AfricaWestern AsiaWestern EuropeYemenZaireZimbabweAzores
Immigrants
Race
Ancestry
AfghanAfricanAlaska NativeAlaskan AthabascanAlbanianAleutAlsatianAmericanApacheArabArapahoArgentineanArmenianAssyrian/Chaldean/SyriacAustralianAustrianBahamianBangladeshiBarbadianBasqueBelgianBelizeanBermudanBhutaneseBlackfeetBolivianBrazilianBritishBritish West IndianBulgarianBurmeseCajunCambodianCanadianCape VerdeanCarpatho RusynCelticCentral AmericanCentral American IndianCherokeeCheyenneChickasawChileanChineseChippewaChoctawColombianColvilleComancheCosta RicanCreeCreekCroatianCrowCubanCypriotCzechCzechoslovakianDanishDelawareDominicanDutchDutch West IndianEastern EuropeanEcuadorianEgyptianEnglishEstonianEthiopianEuropeanFijianFilipinoFinnishFrenchFrench American IndianFrench CanadianGermanGerman RussianGhanaianGreekGuamanian/ChamorroGuatemalanGuyaneseHaitianHmongHonduranHopiHoumaHungarianIcelanderIndian (Asian)IndonesianInupiatIranianIraqiIrishIroquoisIsraeliItalianJamaicanJapaneseJordanianKenyanKiowaKoreanLaotianLatvianLebaneseLiberianLithuanianLumbeeLuxembourgerMacedonianMalaysianMalteseMarshalleseMenomineeMexicanMexican American IndianMongolianMoroccanNative HawaiianNavajoNepaleseNew ZealanderNicaraguanNigerianNorthern EuropeanNorwegianOkinawanOsageOttawaPaiutePakistaniPalestinianPanamanianParaguayanPennsylvania GermanPeruvianPimaPolishPortuguesePotawatomiPuebloPuerto RicanPuget Sound SalishRomanianRussianSalvadoranSamoanScandinavianScotch-IrishScottishSeminoleSenegaleseSerbianShoshoneSierra LeoneanSiouxSlavicSlovakSloveneSomaliSouth AfricanSouth AmericanSouth American IndianSoviet UnionSpaniardSpanishSpanish AmericanSpanish American IndianSri LankanSubsaharan AfricanSudaneseSwedishSwissSyrianTaiwaneseThaiTlingit-HaidaTohono O'OdhamTonganTrinidadian and TobagonianTsimshianTurkishU.S. Virgin IslanderUgandanUkrainianUruguayanUteVenezuelanVietnameseWelshWest IndianYakamaYaquiYugoslavianYumanYup'ikZimbabwean
Immigration
NonimmigrantsImmigrantsAfghanistanAfricaAlbaniaArgentinaArmeniaAsiaAustraliaAustriaBahamasBangladeshBarbadosBelarusBelgiumBelizeBoliviaBosnia and HerzegovinaBrazilBulgariaBurma/MyanmarCabo VerdeCambodiaCameroonCanadaCaribbeanCentral AmericaChileChinaCongoCosta RicaCroatiaCubaCzechoslovakiaDenmarkDominicaDominican RepublicEastern AfricaEastern AsiaEastern EuropeEcuadorEgyptEl SalvadorEnglandEritreaEthiopiaEuropeFijiFranceGermanyGhanaGreeceGrenadaGuatemalaGuyanaHaitiHondurasHong KongHungaryIndiaIndonesiaIranIraqIrelandIsraelItalyJamaicaJapanJordanKazakhstanKenyaKoreaKuwaitLaosLatin AmericaLatviaLebanonLiberiaLithuaniaMalaysiaMexicoMicronesiaMiddle AfricaMoldovaMoroccoNepalNetherlandsNicaraguaNigeriaNorth AmericaNorth MacedoniaNorthern AfricaNorthern EuropeNorwayOceaniaPakistanPanamaPeruPhilippinesPolandPortugalRomaniaRussiaSaudi ArabiaScotlandSenegalSerbiaSierra LeoneSingaporeSomaliaSouth AfricaSouth AmericaSouth Central AsiaSouth Eastern AsiaSouthern EuropeSpainSri LankaSt. Vincent and the GrenadinesSudanSwedenSwitzerlandSyriaTaiwanThailandTrinidad and TobagoTurkeyUgandaUkraineUruguayUzbekistanVenezuelaVietnamWest IndiesWestern AfricaWestern AsiaWestern EuropeYemenZaireZimbabweAzores
In Labor Force | Age 45-54
Income
Poverty
Unemployment
Labor Participation
Family Structure
Vehicle Availability
Education Level
Disability

In Labor Force | Age 45-54 Comparison

Immigrants from Colombia

Immigrants

Exceptional
Tragic
83.4%
IN LABOR FORCE | AGE 45-54
97.6/ 100
METRIC RATING
68th/ 347
METRIC RANK
82.1%
IN LABOR FORCE | AGE 45-54
3.1/ 100
METRIC RATING
223rd/ 347
METRIC RANK

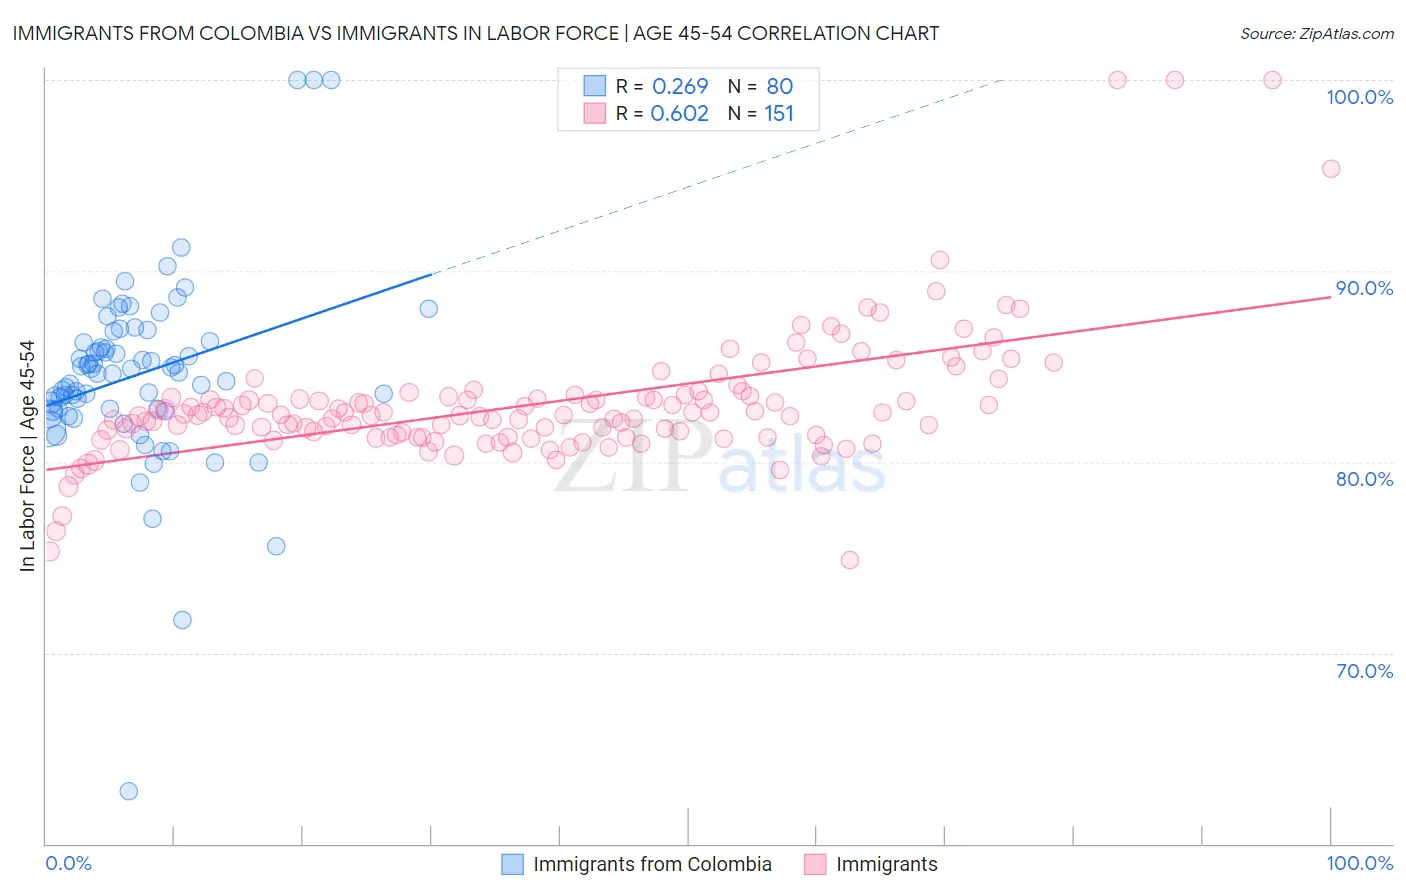
Immigrants from Colombia vs Immigrants In Labor Force | Age 45-54 Correlation Chart

The statistical analysis conducted on geographies consisting of 378,524,126 people shows a weak positive correlation between the proportion of Immigrants from Colombia and labor force participation rate among population between the ages 45 and 54 in the United States with a correlation coefficient (R) of 0.269 and weighted average of 83.4%. Similarly, the statistical analysis conducted on geographies consisting of 576,883,535 people shows a significant positive correlation between the proportion of Immigrants and labor force participation rate among population between the ages 45 and 54 in the United States with a correlation coefficient (R) of 0.602 and weighted average of 82.1%, a difference of 1.6%.
Immigrants from Colombia vs Immigrants In Labor Force | Age 45-54

In Labor Force | Age 45-54 Correlation Summary

MeasurementImmigrants from ColombiaImmigrants
Minimum62.7%74.9%
Maximum100.0%100.0%
Range37.3%25.1%
Mean84.6%83.1%
Median84.7%82.5%
Interquartile 25% (IQ1)82.7%81.3%
Interquartile 75% (IQ3)86.3%83.4%
Interquartile Range (IQR)3.6%2.1%
Standard Deviation (Sample)5.0%3.5%
Standard Deviation (Population)5.0%3.5%

Similar Demographics by In Labor Force | Age 45-54

Demographics Similar to Immigrants from Colombia by In Labor Force | Age 45-54

In terms of in labor force | age 45-54, the demographic groups most similar to Immigrants from Colombia are Chilean (83.4%, a difference of 0.010%), Taiwanese (83.4%, a difference of 0.010%), Asian (83.4%, a difference of 0.020%), Immigrants from Latvia (83.4%, a difference of 0.020%), and Colombian (83.4%, a difference of 0.020%).
DemographicsRating | RankIn Labor Force | Age 45-54
Filipinos
98.3
/100
|
#61
Exceptional
83.5%
Immigrants | Taiwan
98.0
/100
|
#62
Exceptional
83.5%
Afghans
97.9
/100
|
#63
Exceptional
83.5%
Immigrants | Kenya
97.9
/100
|
#64
Exceptional
83.5%
Egyptians
97.9
/100
|
#65
Exceptional
83.5%
Asians
97.7
/100
|
#66
Exceptional
83.4%
Chileans
97.7
/100
|
#67
Exceptional
83.4%
Immigrants | Colombia
97.6
/100
|
#68
Exceptional
83.4%
Taiwanese
97.5
/100
|
#69
Exceptional
83.4%
Immigrants | Latvia
97.4
/100
|
#70
Exceptional
83.4%
Colombians
97.3
/100
|
#71
Exceptional
83.4%
Serbians
97.2
/100
|
#72
Exceptional
83.4%
Immigrants | Czechoslovakia
97.1
/100
|
#73
Exceptional
83.4%
Immigrants | Somalia
96.9
/100
|
#74
Exceptional
83.4%
Estonians
96.9
/100
|
#75
Exceptional
83.4%

Demographics Similar to Immigrants by In Labor Force | Age 45-54

In terms of in labor force | age 45-54, the demographic groups most similar to Immigrants are Panamanian (82.2%, a difference of 0.020%), Immigrants from Ecuador (82.2%, a difference of 0.020%), Bahamian (82.2%, a difference of 0.030%), Immigrants from Jamaica (82.1%, a difference of 0.030%), and Immigrants from Oceania (82.1%, a difference of 0.050%).
DemographicsRating | RankIn Labor Force | Age 45-54
Scottish
5.3
/100
|
#216
Tragic
82.2%
Portuguese
4.7
/100
|
#217
Tragic
82.2%
English
4.4
/100
|
#218
Tragic
82.2%
French
4.1
/100
|
#219
Tragic
82.2%
Bahamians
3.6
/100
|
#220
Tragic
82.2%
Panamanians
3.5
/100
|
#221
Tragic
82.2%
Immigrants | Ecuador
3.4
/100
|
#222
Tragic
82.2%
Immigrants | Immigrants
3.1
/100
|
#223
Tragic
82.1%
Immigrants | Jamaica
2.7
/100
|
#224
Tragic
82.1%
Immigrants | Oceania
2.5
/100
|
#225
Tragic
82.1%
Immigrants | Caribbean
2.5
/100
|
#226
Tragic
82.1%
Immigrants | Germany
2.4
/100
|
#227
Tragic
82.1%
Cape Verdeans
2.1
/100
|
#228
Tragic
82.1%
Immigrants | Burma/Myanmar
1.9
/100
|
#229
Tragic
82.0%
Jamaicans
1.8
/100
|
#230
Tragic
82.0%