Immigrants from Honduras vs Immigrants In Labor Force | Age 45-54

COMPARE

Immigrants from Honduras
Race
Ancestry
AfghanAfricanAlaska NativeAlaskan AthabascanAlbanianAleutAlsatianAmericanApacheArabArapahoArgentineanArmenianAssyrian/Chaldean/SyriacAustralianAustrianBahamianBangladeshiBarbadianBasqueBelgianBelizeanBermudanBhutaneseBlackfeetBolivianBrazilianBritishBritish West IndianBulgarianBurmeseCajunCambodianCanadianCape VerdeanCarpatho RusynCelticCentral AmericanCentral American IndianCherokeeCheyenneChickasawChileanChineseChippewaChoctawColombianColvilleComancheCosta RicanCreeCreekCroatianCrowCubanCypriotCzechCzechoslovakianDanishDelawareDominicanDutchDutch West IndianEastern EuropeanEcuadorianEgyptianEnglishEstonianEthiopianEuropeanFijianFilipinoFinnishFrenchFrench American IndianFrench CanadianGermanGerman RussianGhanaianGreekGuamanian/ChamorroGuatemalanGuyaneseHaitianHmongHonduranHopiHoumaHungarianIcelanderIndian (Asian)IndonesianInupiatIranianIraqiIrishIroquoisIsraeliItalianJamaicanJapaneseJordanianKenyanKiowaKoreanLaotianLatvianLebaneseLiberianLithuanianLumbeeLuxembourgerMacedonianMalaysianMalteseMarshalleseMenomineeMexicanMexican American IndianMongolianMoroccanNative HawaiianNavajoNepaleseNew ZealanderNicaraguanNigerianNorthern EuropeanNorwegianOkinawanOsageOttawaPaiutePakistaniPalestinianPanamanianParaguayanPennsylvania GermanPeruvianPimaPolishPortuguesePotawatomiPuebloPuerto RicanPuget Sound SalishRomanianRussianSalvadoranSamoanScandinavianScotch-IrishScottishSeminoleSenegaleseSerbianShoshoneSierra LeoneanSiouxSlavicSlovakSloveneSomaliSouth AfricanSouth AmericanSouth American IndianSoviet UnionSpaniardSpanishSpanish AmericanSpanish American IndianSri LankanSubsaharan AfricanSudaneseSwedishSwissSyrianTaiwaneseThaiTlingit-HaidaTohono O'OdhamTonganTrinidadian and TobagonianTsimshianTurkishU.S. Virgin IslanderUgandanUkrainianUruguayanUteVenezuelanVietnameseWelshWest IndianYakamaYaquiYugoslavianYumanYup'ikZimbabwean
Immigration
NonimmigrantsAfghanistanAfricaAlbaniaArgentinaArmeniaAsiaAustraliaAustriaBahamasBangladeshBarbadosBelarusBelgiumBelizeBoliviaBosnia and HerzegovinaBrazilBulgariaBurma/MyanmarCabo VerdeCambodiaCameroonCanadaCaribbeanCentral AmericaChileChinaColombiaCongoCosta RicaCroatiaCubaCzechoslovakiaDenmarkDominicaDominican RepublicEastern AfricaEastern AsiaEastern EuropeEcuadorEgyptEl SalvadorEnglandEritreaEthiopiaEuropeFijiFranceGermanyGhanaGreeceGrenadaGuatemalaGuyanaHaitiHondurasHong KongHungaryIndiaIndonesiaIranIraqIrelandIsraelItalyJamaicaJapanJordanKazakhstanKenyaKoreaKuwaitLaosLatin AmericaLatviaLebanonLiberiaLithuaniaMalaysiaMexicoMicronesiaMiddle AfricaMoldovaMoroccoNepalNetherlandsNicaraguaNigeriaNorth AmericaNorth MacedoniaNorthern AfricaNorthern EuropeNorwayOceaniaPakistanPanamaPeruPhilippinesPolandPortugalRomaniaRussiaSaudi ArabiaScotlandSenegalSerbiaSierra LeoneSingaporeSomaliaSouth AfricaSouth AmericaSouth Central AsiaSouth Eastern AsiaSouthern EuropeSpainSri LankaSt. Vincent and the GrenadinesSudanSwedenSwitzerlandSyriaTaiwanThailandTrinidad and TobagoTurkeyUgandaUkraineUruguayUzbekistanVenezuelaVietnamWest IndiesWestern AfricaWestern AsiaWestern EuropeYemenZaireZimbabweAzores
Immigrants
Race
Ancestry
AfghanAfricanAlaska NativeAlaskan AthabascanAlbanianAleutAlsatianAmericanApacheArabArapahoArgentineanArmenianAssyrian/Chaldean/SyriacAustralianAustrianBahamianBangladeshiBarbadianBasqueBelgianBelizeanBermudanBhutaneseBlackfeetBolivianBrazilianBritishBritish West IndianBulgarianBurmeseCajunCambodianCanadianCape VerdeanCarpatho RusynCelticCentral AmericanCentral American IndianCherokeeCheyenneChickasawChileanChineseChippewaChoctawColombianColvilleComancheCosta RicanCreeCreekCroatianCrowCubanCypriotCzechCzechoslovakianDanishDelawareDominicanDutchDutch West IndianEastern EuropeanEcuadorianEgyptianEnglishEstonianEthiopianEuropeanFijianFilipinoFinnishFrenchFrench American IndianFrench CanadianGermanGerman RussianGhanaianGreekGuamanian/ChamorroGuatemalanGuyaneseHaitianHmongHonduranHopiHoumaHungarianIcelanderIndian (Asian)IndonesianInupiatIranianIraqiIrishIroquoisIsraeliItalianJamaicanJapaneseJordanianKenyanKiowaKoreanLaotianLatvianLebaneseLiberianLithuanianLumbeeLuxembourgerMacedonianMalaysianMalteseMarshalleseMenomineeMexicanMexican American IndianMongolianMoroccanNative HawaiianNavajoNepaleseNew ZealanderNicaraguanNigerianNorthern EuropeanNorwegianOkinawanOsageOttawaPaiutePakistaniPalestinianPanamanianParaguayanPennsylvania GermanPeruvianPimaPolishPortuguesePotawatomiPuebloPuerto RicanPuget Sound SalishRomanianRussianSalvadoranSamoanScandinavianScotch-IrishScottishSeminoleSenegaleseSerbianShoshoneSierra LeoneanSiouxSlavicSlovakSloveneSomaliSouth AfricanSouth AmericanSouth American IndianSoviet UnionSpaniardSpanishSpanish AmericanSpanish American IndianSri LankanSubsaharan AfricanSudaneseSwedishSwissSyrianTaiwaneseThaiTlingit-HaidaTohono O'OdhamTonganTrinidadian and TobagonianTsimshianTurkishU.S. Virgin IslanderUgandanUkrainianUruguayanUteVenezuelanVietnameseWelshWest IndianYakamaYaquiYugoslavianYumanYup'ikZimbabwean
Immigration
NonimmigrantsImmigrantsAfghanistanAfricaAlbaniaArgentinaArmeniaAsiaAustraliaAustriaBahamasBangladeshBarbadosBelarusBelgiumBelizeBoliviaBosnia and HerzegovinaBrazilBulgariaBurma/MyanmarCabo VerdeCambodiaCameroonCanadaCaribbeanCentral AmericaChileChinaColombiaCongoCosta RicaCroatiaCubaCzechoslovakiaDenmarkDominicaDominican RepublicEastern AfricaEastern AsiaEastern EuropeEcuadorEgyptEl SalvadorEnglandEritreaEthiopiaEuropeFijiFranceGermanyGhanaGreeceGrenadaGuatemalaGuyanaHaitiHong KongHungaryIndiaIndonesiaIranIraqIrelandIsraelItalyJamaicaJapanJordanKazakhstanKenyaKoreaKuwaitLaosLatin AmericaLatviaLebanonLiberiaLithuaniaMalaysiaMexicoMicronesiaMiddle AfricaMoldovaMoroccoNepalNetherlandsNicaraguaNigeriaNorth AmericaNorth MacedoniaNorthern AfricaNorthern EuropeNorwayOceaniaPakistanPanamaPeruPhilippinesPolandPortugalRomaniaRussiaSaudi ArabiaScotlandSenegalSerbiaSierra LeoneSingaporeSomaliaSouth AfricaSouth AmericaSouth Central AsiaSouth Eastern AsiaSouthern EuropeSpainSri LankaSt. Vincent and the GrenadinesSudanSwedenSwitzerlandSyriaTaiwanThailandTrinidad and TobagoTurkeyUgandaUkraineUruguayUzbekistanVenezuelaVietnamWest IndiesWestern AfricaWestern AsiaWestern EuropeYemenZaireZimbabweAzores
In Labor Force | Age 45-54
Income
Poverty
Unemployment
Labor Participation
Family Structure
Vehicle Availability
Education Level
Disability

In Labor Force | Age 45-54 Comparison

Immigrants from Honduras

Immigrants

Tragic
Tragic
81.4%
IN LABOR FORCE | AGE 45-54
0.0/ 100
METRIC RATING
268th/ 347
METRIC RANK
82.1%
IN LABOR FORCE | AGE 45-54
3.1/ 100
METRIC RATING
223rd/ 347
METRIC RANK

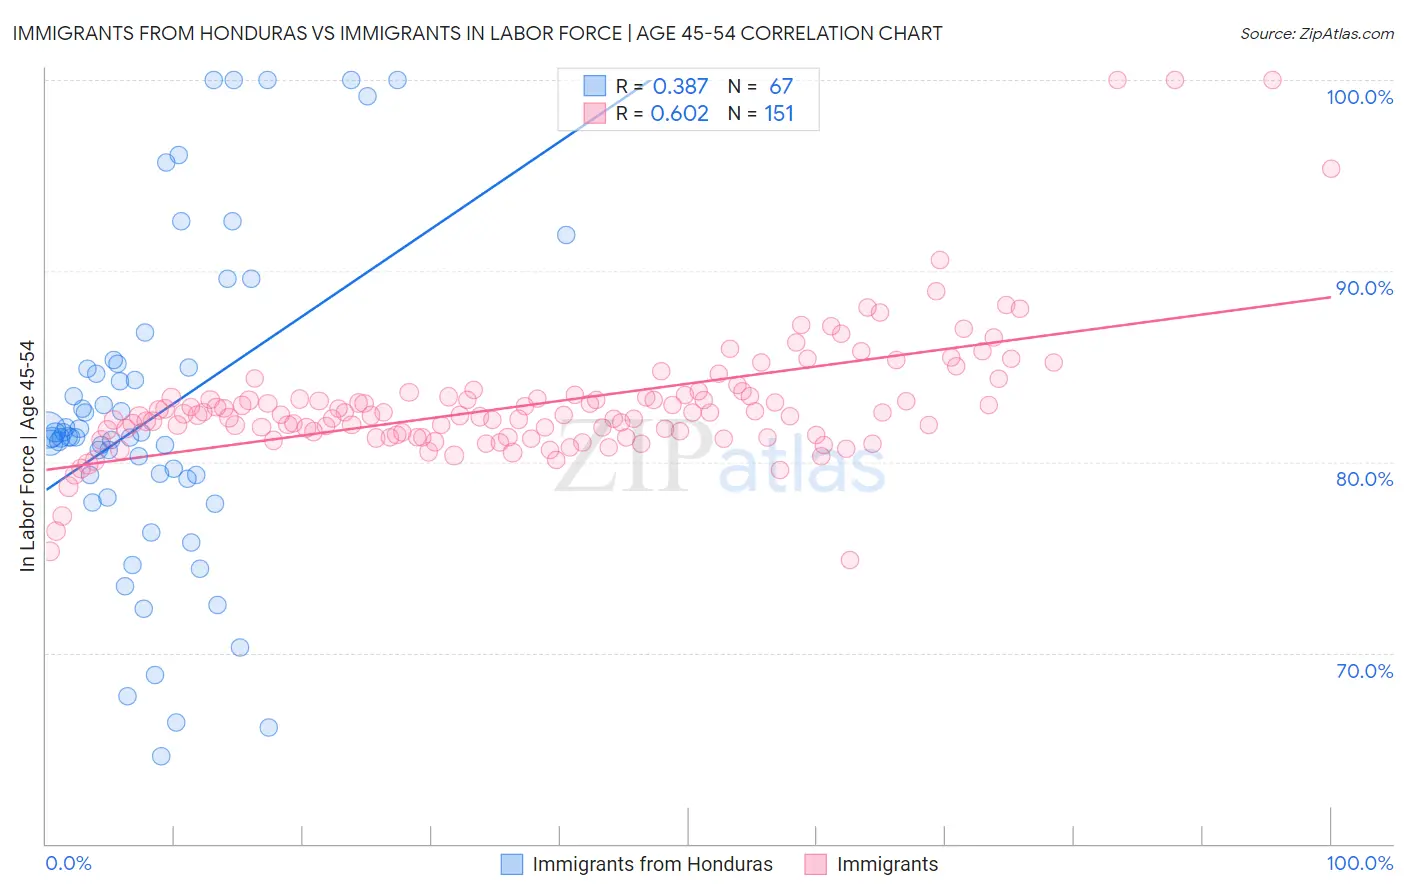
Immigrants from Honduras vs Immigrants In Labor Force | Age 45-54 Correlation Chart

The statistical analysis conducted on geographies consisting of 322,456,034 people shows a mild positive correlation between the proportion of Immigrants from Honduras and labor force participation rate among population between the ages 45 and 54 in the United States with a correlation coefficient (R) of 0.387 and weighted average of 81.4%. Similarly, the statistical analysis conducted on geographies consisting of 576,883,535 people shows a significant positive correlation between the proportion of Immigrants and labor force participation rate among population between the ages 45 and 54 in the United States with a correlation coefficient (R) of 0.602 and weighted average of 82.1%, a difference of 0.95%.
Immigrants from Honduras vs Immigrants In Labor Force | Age 45-54

In Labor Force | Age 45-54 Correlation Summary

MeasurementImmigrants from HondurasImmigrants
Minimum64.6%74.9%
Maximum100.0%100.0%
Range35.4%25.1%
Mean82.4%83.1%
Median81.3%82.5%
Interquartile 25% (IQ1)79.1%81.3%
Interquartile 75% (IQ3)84.9%83.4%
Interquartile Range (IQR)5.8%2.1%
Standard Deviation (Sample)8.4%3.5%
Standard Deviation (Population)8.3%3.5%

Similar Demographics by In Labor Force | Age 45-54

Demographics Similar to Immigrants from Honduras by In Labor Force | Age 45-54

In terms of in labor force | age 45-54, the demographic groups most similar to Immigrants from Honduras are West Indian (81.4%, a difference of 0.020%), Alsatian (81.3%, a difference of 0.020%), Immigrants from St. Vincent and the Grenadines (81.4%, a difference of 0.030%), Bangladeshi (81.3%, a difference of 0.050%), and Immigrants from Barbados (81.3%, a difference of 0.060%).
DemographicsRating | RankIn Labor Force | Age 45-54
Hawaiians
0.1
/100
|
#261
Tragic
81.5%
Immigrants | Guyana
0.1
/100
|
#262
Tragic
81.5%
Indonesians
0.1
/100
|
#263
Tragic
81.5%
Immigrants | West Indies
0.1
/100
|
#264
Tragic
81.5%
Hondurans
0.1
/100
|
#265
Tragic
81.4%
Immigrants | St. Vincent and the Grenadines
0.1
/100
|
#266
Tragic
81.4%
West Indians
0.1
/100
|
#267
Tragic
81.4%
Immigrants | Honduras
0.0
/100
|
#268
Tragic
81.4%
Alsatians
0.0
/100
|
#269
Tragic
81.3%
Bangladeshis
0.0
/100
|
#270
Tragic
81.3%
Immigrants | Barbados
0.0
/100
|
#271
Tragic
81.3%
Spanish
0.0
/100
|
#272
Tragic
81.3%
Chippewa
0.0
/100
|
#273
Tragic
81.3%
British West Indians
0.0
/100
|
#274
Tragic
81.2%
Immigrants | Nonimmigrants
0.0
/100
|
#275
Tragic
81.2%

Demographics Similar to Immigrants by In Labor Force | Age 45-54

In terms of in labor force | age 45-54, the demographic groups most similar to Immigrants are Panamanian (82.2%, a difference of 0.020%), Immigrants from Ecuador (82.2%, a difference of 0.020%), Bahamian (82.2%, a difference of 0.030%), Immigrants from Jamaica (82.1%, a difference of 0.030%), and Immigrants from Oceania (82.1%, a difference of 0.050%).
DemographicsRating | RankIn Labor Force | Age 45-54
Scottish
5.3
/100
|
#216
Tragic
82.2%
Portuguese
4.7
/100
|
#217
Tragic
82.2%
English
4.4
/100
|
#218
Tragic
82.2%
French
4.1
/100
|
#219
Tragic
82.2%
Bahamians
3.6
/100
|
#220
Tragic
82.2%
Panamanians
3.5
/100
|
#221
Tragic
82.2%
Immigrants | Ecuador
3.4
/100
|
#222
Tragic
82.2%
Immigrants | Immigrants
3.1
/100
|
#223
Tragic
82.1%
Immigrants | Jamaica
2.7
/100
|
#224
Tragic
82.1%
Immigrants | Oceania
2.5
/100
|
#225
Tragic
82.1%
Immigrants | Caribbean
2.5
/100
|
#226
Tragic
82.1%
Immigrants | Germany
2.4
/100
|
#227
Tragic
82.1%
Cape Verdeans
2.1
/100
|
#228
Tragic
82.1%
Immigrants | Burma/Myanmar
1.9
/100
|
#229
Tragic
82.0%
Jamaicans
1.8
/100
|
#230
Tragic
82.0%