Immigrants from Middle Africa vs Immigrants from Trinidad and Tobago In Labor Force | Age 20-64
COMPARE
Immigrants from Middle Africa
Immigrants from Trinidad and Tobago
In Labor Force | Age 20-64
In Labor Force | Age 20-64 Comparison
Immigrants from Middle Africa
Immigrants from Trinidad and Tobago
80.5%
IN LABOR FORCE | AGE 20-64
99.7/ 100
METRIC RATING
44th/ 347
METRIC RANK
78.8%
IN LABOR FORCE | AGE 20-64
1.1/ 100
METRIC RATING
246th/ 347
METRIC RANK
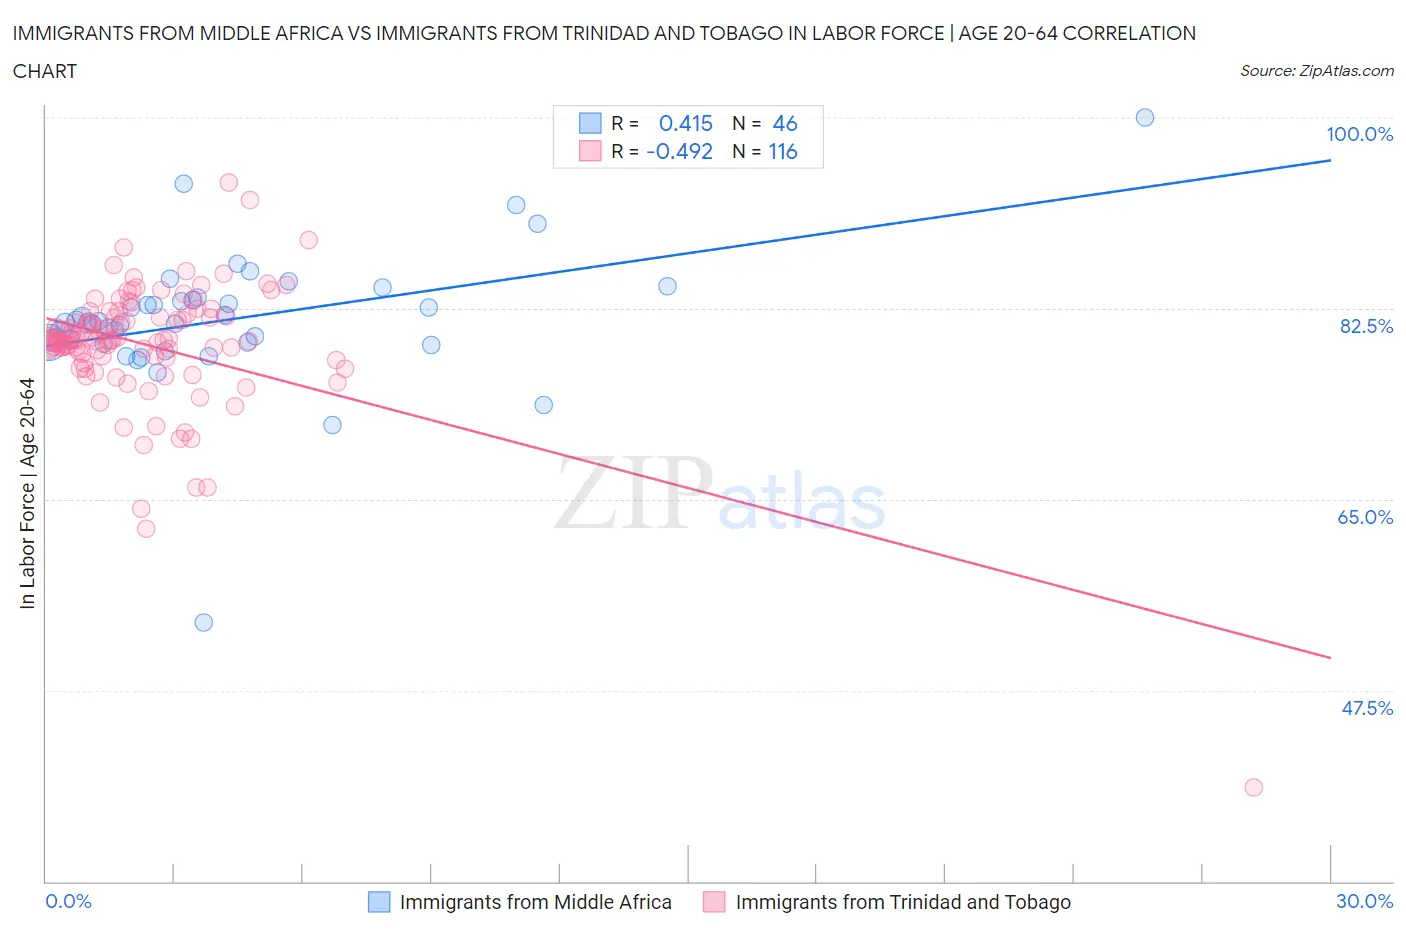
Immigrants from Middle Africa vs Immigrants from Trinidad and Tobago In Labor Force | Age 20-64 Correlation Chart
The statistical analysis conducted on geographies consisting of 202,739,694 people shows a moderate positive correlation between the proportion of Immigrants from Middle Africa and labor force participation rate among population between the ages 20 and 64 in the United States with a correlation coefficient (R) of 0.415 and weighted average of 80.5%. Similarly, the statistical analysis conducted on geographies consisting of 223,537,592 people shows a moderate negative correlation between the proportion of Immigrants from Trinidad and Tobago and labor force participation rate among population between the ages 20 and 64 in the United States with a correlation coefficient (R) of -0.492 and weighted average of 78.8%, a difference of 2.1%.
In Labor Force | Age 20-64 Correlation Summary
| Measurement | Immigrants from Middle Africa | Immigrants from Trinidad and Tobago |
| Minimum | 53.7% | 38.6% |
| Maximum | 100.0% | 94.0% |
| Range | 46.3% | 55.4% |
| Mean | 81.5% | 79.1% |
| Median | 81.2% | 79.6% |
| Interquartile 25% (IQ1) | 79.4% | 78.1% |
| Interquartile 75% (IQ3) | 83.3% | 81.7% |
| Interquartile Range (IQR) | 3.9% | 3.7% |
| Standard Deviation (Sample) | 6.4% | 6.1% |
| Standard Deviation (Population) | 6.3% | 6.1% |
Similar Demographics by In Labor Force | Age 20-64
Demographics Similar to Immigrants from Middle Africa by In Labor Force | Age 20-64
In terms of in labor force | age 20-64, the demographic groups most similar to Immigrants from Middle Africa are Slovene (80.5%, a difference of 0.020%), Czech (80.5%, a difference of 0.030%), Immigrants from Pakistan (80.5%, a difference of 0.030%), Latvian (80.5%, a difference of 0.040%), and Immigrants from Liberia (80.5%, a difference of 0.060%).
| Demographics | Rating | Rank | In Labor Force | Age 20-64 |
| Immigrants | Moldova | 99.8 /100 | #37 | Exceptional 80.6% |
| Ugandans | 99.8 /100 | #38 | Exceptional 80.6% |
| Brazilians | 99.8 /100 | #39 | Exceptional 80.5% |
| Immigrants | Zimbabwe | 99.8 /100 | #40 | Exceptional 80.5% |
| Immigrants | Liberia | 99.8 /100 | #41 | Exceptional 80.5% |
| Latvians | 99.8 /100 | #42 | Exceptional 80.5% |
| Czechs | 99.7 /100 | #43 | Exceptional 80.5% |
| Immigrants | Middle Africa | 99.7 /100 | #44 | Exceptional 80.5% |
| Slovenes | 99.7 /100 | #45 | Exceptional 80.5% |
| Immigrants | Pakistan | 99.6 /100 | #46 | Exceptional 80.5% |
| Immigrants | Africa | 99.6 /100 | #47 | Exceptional 80.4% |
| Immigrants | Hong Kong | 99.5 /100 | #48 | Exceptional 80.4% |
| Immigrants | Greece | 99.4 /100 | #49 | Exceptional 80.4% |
| Immigrants | Sudan | 99.4 /100 | #50 | Exceptional 80.4% |
| Immigrants | Sri Lanka | 99.3 /100 | #51 | Exceptional 80.4% |
Demographics Similar to Immigrants from Trinidad and Tobago by In Labor Force | Age 20-64
In terms of in labor force | age 20-64, the demographic groups most similar to Immigrants from Trinidad and Tobago are Immigrants from Germany (78.8%, a difference of 0.020%), Immigrants from Caribbean (78.8%, a difference of 0.020%), Scottish (78.9%, a difference of 0.030%), English (78.8%, a difference of 0.050%), and French (78.9%, a difference of 0.060%).
| Demographics | Rating | Rank | In Labor Force | Age 20-64 |
| Welsh | 2.4 /100 | #239 | Tragic 79.0% |
| Trinidadians and Tobagonians | 2.3 /100 | #240 | Tragic 79.0% |
| Jamaicans | 2.0 /100 | #241 | Tragic 78.9% |
| Immigrants | Micronesia | 1.9 /100 | #242 | Tragic 78.9% |
| Immigrants | West Indies | 1.7 /100 | #243 | Tragic 78.9% |
| French | 1.5 /100 | #244 | Tragic 78.9% |
| Scottish | 1.3 /100 | #245 | Tragic 78.9% |
| Immigrants | Trinidad and Tobago | 1.1 /100 | #246 | Tragic 78.8% |
| Immigrants | Germany | 1.0 /100 | #247 | Tragic 78.8% |
| Immigrants | Caribbean | 1.0 /100 | #248 | Tragic 78.8% |
| English | 0.9 /100 | #249 | Tragic 78.8% |
| Hondurans | 0.8 /100 | #250 | Tragic 78.8% |
| Barbadians | 0.7 /100 | #251 | Tragic 78.8% |
| Immigrants | Honduras | 0.6 /100 | #252 | Tragic 78.7% |
| Basques | 0.5 /100 | #253 | Tragic 78.7% |