Immigrants from Micronesia vs Immigrants from Laos Female Poverty Among 18-24 Year Olds
COMPARE
Immigrants from Micronesia
Immigrants from Laos
Female Poverty Among 18-24 Year Olds
Female Poverty Among 18-24 Year Olds Comparison
Immigrants from Micronesia
Immigrants from Laos
20.7%
FEMALE POVERTY AMONG 18-24 YEAR OLDS
9.6/ 100
METRIC RATING
219th/ 347
METRIC RANK
20.6%
FEMALE POVERTY AMONG 18-24 YEAR OLDS
9.7/ 100
METRIC RATING
217th/ 347
METRIC RANK
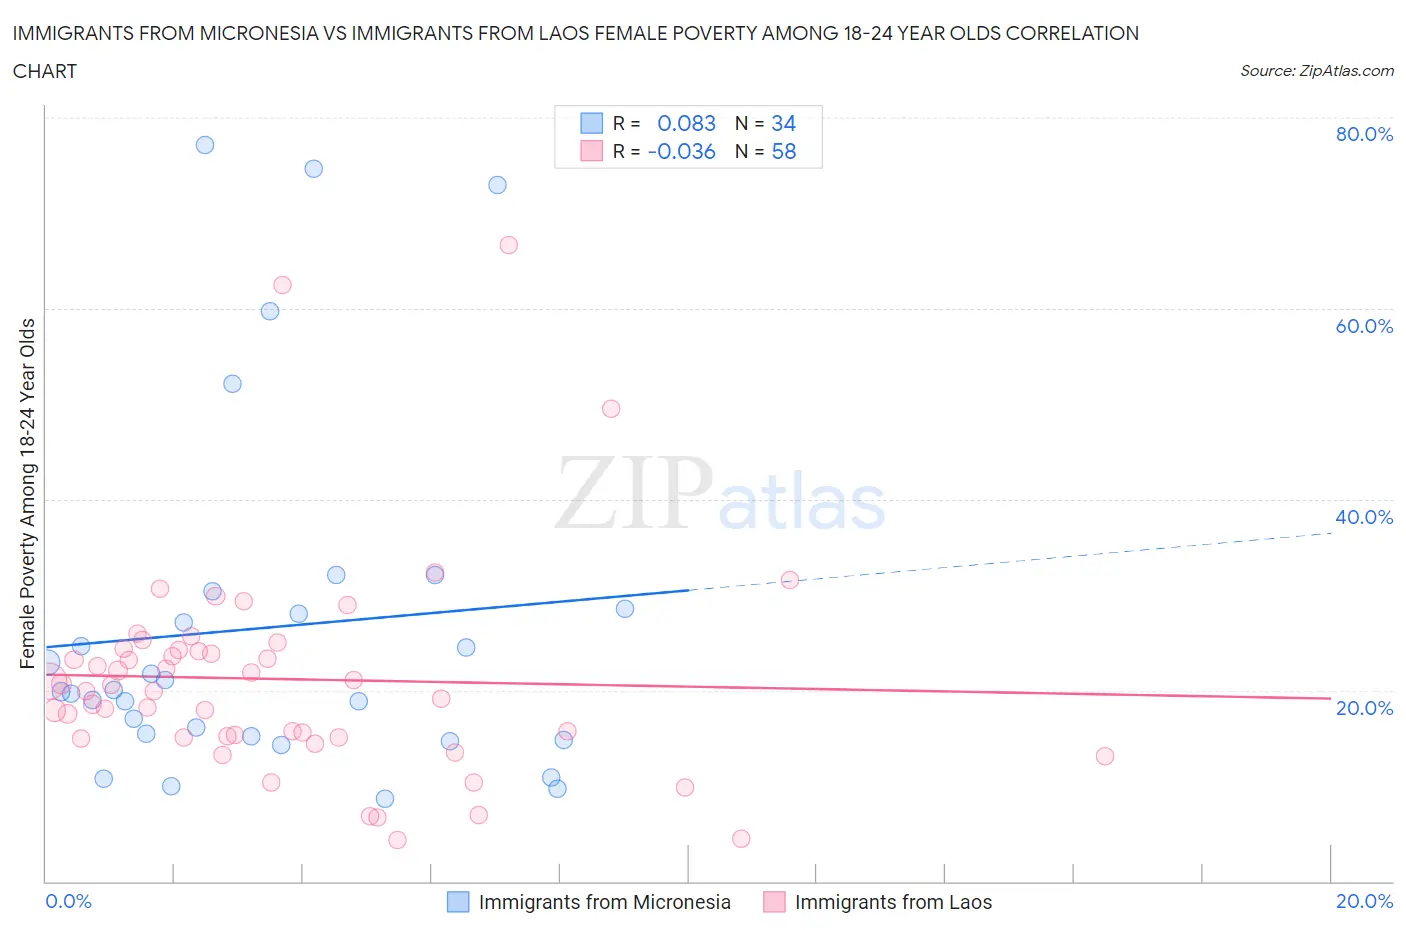
Immigrants from Micronesia vs Immigrants from Laos Female Poverty Among 18-24 Year Olds Correlation Chart
The statistical analysis conducted on geographies consisting of 61,440,220 people shows a slight positive correlation between the proportion of Immigrants from Micronesia and poverty level among females between the ages 18 and 24 in the United States with a correlation coefficient (R) of 0.083 and weighted average of 20.7%. Similarly, the statistical analysis conducted on geographies consisting of 199,404,827 people shows no correlation between the proportion of Immigrants from Laos and poverty level among females between the ages 18 and 24 in the United States with a correlation coefficient (R) of -0.036 and weighted average of 20.6%, a difference of 0.020%.
Female Poverty Among 18-24 Year Olds Correlation Summary
| Measurement | Immigrants from Micronesia | Immigrants from Laos |
| Minimum | 8.7% | 4.4% |
| Maximum | 77.1% | 66.7% |
| Range | 68.4% | 62.3% |
| Mean | 26.6% | 21.2% |
| Median | 19.9% | 20.2% |
| Interquartile 25% (IQ1) | 15.2% | 15.1% |
| Interquartile 75% (IQ3) | 28.6% | 24.2% |
| Interquartile Range (IQR) | 13.4% | 9.2% |
| Standard Deviation (Sample) | 18.7% | 11.4% |
| Standard Deviation (Population) | 18.4% | 11.3% |
Demographics Similar to Immigrants from Micronesia and Immigrants from Laos by Female Poverty Among 18-24 Year Olds
In terms of female poverty among 18-24 year olds, the demographic groups most similar to Immigrants from Micronesia are Immigrants from Nepal (20.7%, a difference of 0.010%), British (20.7%, a difference of 0.020%), Immigrants from Western Africa (20.6%, a difference of 0.090%), Barbadian (20.7%, a difference of 0.090%), and Spanish (20.6%, a difference of 0.11%). Similarly, the demographic groups most similar to Immigrants from Laos are Immigrants from Nepal (20.7%, a difference of 0.010%), British (20.7%, a difference of 0.040%), Immigrants from Western Africa (20.6%, a difference of 0.070%), Spanish (20.6%, a difference of 0.090%), and Barbadian (20.7%, a difference of 0.11%).
| Demographics | Rating | Rank | Female Poverty Among 18-24 Year Olds |
| Dutch | 15.9 /100 | #208 | Poor 20.5% |
| Arabs | 15.5 /100 | #209 | Poor 20.5% |
| Immigrants | Ghana | 14.3 /100 | #210 | Poor 20.5% |
| Immigrants | Western Europe | 13.5 /100 | #211 | Poor 20.6% |
| Liberians | 11.6 /100 | #212 | Poor 20.6% |
| Northern Europeans | 11.6 /100 | #213 | Poor 20.6% |
| Immigrants | South Africa | 10.7 /100 | #214 | Poor 20.6% |
| Spanish | 10.4 /100 | #215 | Poor 20.6% |
| Immigrants | Western Africa | 10.2 /100 | #216 | Poor 20.6% |
| Immigrants | Laos | 9.7 /100 | #217 | Tragic 20.6% |
| Immigrants | Nepal | 9.6 /100 | #218 | Tragic 20.7% |
| Immigrants | Micronesia | 9.6 /100 | #219 | Tragic 20.7% |
| British | 9.4 /100 | #220 | Tragic 20.7% |
| Barbadians | 9.0 /100 | #221 | Tragic 20.7% |
| Guatemalans | 8.1 /100 | #222 | Tragic 20.7% |
| French | 7.9 /100 | #223 | Tragic 20.7% |
| Immigrants | Liberia | 7.6 /100 | #224 | Tragic 20.7% |
| Norwegians | 7.3 /100 | #225 | Tragic 20.7% |
| Estonians | 7.2 /100 | #226 | Tragic 20.7% |
| Immigrants | Sweden | 6.8 /100 | #227 | Tragic 20.7% |
| Ghanaians | 6.5 /100 | #228 | Tragic 20.8% |