Immigrants from Micronesia vs Immigrants from Laos Householder Income Under 25 years
COMPARE
Immigrants from Micronesia
Immigrants from Laos
Householder Income Under 25 years
Householder Income Under 25 years Comparison
Immigrants from Micronesia
Immigrants from Laos
$50,691
HOUSEHOLDER INCOME UNDER 25 YEARS
2.5/ 100
METRIC RATING
241st/ 347
METRIC RANK
$50,041
HOUSEHOLDER INCOME UNDER 25 YEARS
0.5/ 100
METRIC RATING
267th/ 347
METRIC RANK
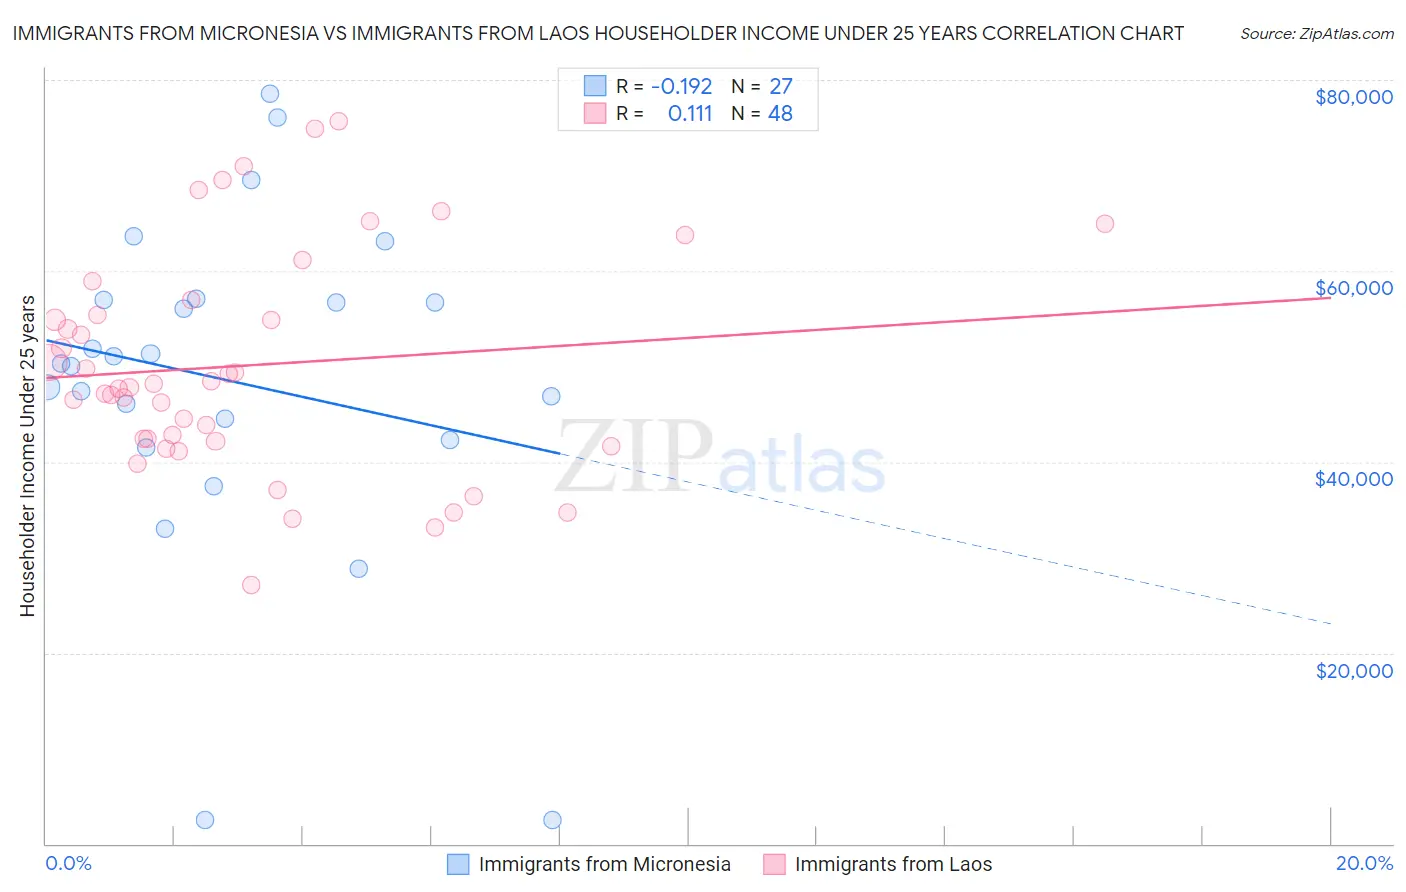
Immigrants from Micronesia vs Immigrants from Laos Householder Income Under 25 years Correlation Chart
The statistical analysis conducted on geographies consisting of 59,129,398 people shows a poor negative correlation between the proportion of Immigrants from Micronesia and household income with householder under the age of 25 in the United States with a correlation coefficient (R) of -0.192 and weighted average of $50,691. Similarly, the statistical analysis conducted on geographies consisting of 183,790,099 people shows a poor positive correlation between the proportion of Immigrants from Laos and household income with householder under the age of 25 in the United States with a correlation coefficient (R) of 0.111 and weighted average of $50,041, a difference of 1.3%.
Householder Income Under 25 years Correlation Summary
| Measurement | Immigrants from Micronesia | Immigrants from Laos |
| Minimum | $2,499 | $27,039 |
| Maximum | $78,500 | $75,734 |
| Range | $76,001 | $48,695 |
| Mean | $48,503 | $50,097 |
| Median | $50,317 | $48,012 |
| Interquartile 25% (IQ1) | $42,250 | $42,252 |
| Interquartile 75% (IQ3) | $57,007 | $56,151 |
| Interquartile Range (IQR) | $14,757 | $13,899 |
| Standard Deviation (Sample) | $17,553 | $11,568 |
| Standard Deviation (Population) | $17,225 | $11,447 |
Similar Demographics by Householder Income Under 25 years
Demographics Similar to Immigrants from Micronesia by Householder Income Under 25 years
In terms of householder income under 25 years, the demographic groups most similar to Immigrants from Micronesia are Cuban ($50,655, a difference of 0.070%), Immigrants from Lebanon ($50,729, a difference of 0.080%), Immigrants from Thailand ($50,645, a difference of 0.090%), Marshallese ($50,627, a difference of 0.12%), and Immigrants from Caribbean ($50,757, a difference of 0.13%).
| Demographics | Rating | Rank | Householder Income Under 25 years |
| Kenyans | 3.3 /100 | #234 | Tragic $50,815 |
| Spanish | 3.3 /100 | #235 | Tragic $50,813 |
| English | 3.3 /100 | #236 | Tragic $50,805 |
| Germans | 3.3 /100 | #237 | Tragic $50,804 |
| Iraqis | 3.2 /100 | #238 | Tragic $50,802 |
| Immigrants | Caribbean | 2.9 /100 | #239 | Tragic $50,757 |
| Immigrants | Lebanon | 2.7 /100 | #240 | Tragic $50,729 |
| Immigrants | Micronesia | 2.5 /100 | #241 | Tragic $50,691 |
| Cubans | 2.3 /100 | #242 | Tragic $50,655 |
| Immigrants | Thailand | 2.2 /100 | #243 | Tragic $50,645 |
| Marshallese | 2.1 /100 | #244 | Tragic $50,627 |
| Immigrants | Africa | 2.0 /100 | #245 | Tragic $50,609 |
| Welsh | 2.0 /100 | #246 | Tragic $50,597 |
| Immigrants | Bosnia and Herzegovina | 1.8 /100 | #247 | Tragic $50,565 |
| Slavs | 1.8 /100 | #248 | Tragic $50,563 |
Demographics Similar to Immigrants from Laos by Householder Income Under 25 years
In terms of householder income under 25 years, the demographic groups most similar to Immigrants from Laos are Venezuelan ($50,011, a difference of 0.060%), Ute ($49,997, a difference of 0.090%), Mexican ($49,989, a difference of 0.10%), Belgian ($50,113, a difference of 0.14%), and Immigrants from Venezuela ($50,109, a difference of 0.14%).
| Demographics | Rating | Rank | Householder Income Under 25 years |
| Hispanics or Latinos | 0.9 /100 | #260 | Tragic $50,279 |
| Hungarians | 0.9 /100 | #261 | Tragic $50,247 |
| Haitians | 0.8 /100 | #262 | Tragic $50,231 |
| Immigrants | Dominican Republic | 0.8 /100 | #263 | Tragic $50,204 |
| Fijians | 0.6 /100 | #264 | Tragic $50,132 |
| Belgians | 0.6 /100 | #265 | Tragic $50,113 |
| Immigrants | Venezuela | 0.6 /100 | #266 | Tragic $50,109 |
| Immigrants | Laos | 0.5 /100 | #267 | Tragic $50,041 |
| Venezuelans | 0.5 /100 | #268 | Tragic $50,011 |
| Ute | 0.5 /100 | #269 | Tragic $49,997 |
| Mexicans | 0.5 /100 | #270 | Tragic $49,989 |
| Taiwanese | 0.3 /100 | #271 | Tragic $49,804 |
| Colville | 0.3 /100 | #272 | Tragic $49,774 |
| Slovaks | 0.3 /100 | #273 | Tragic $49,753 |
| Immigrants | Senegal | 0.3 /100 | #274 | Tragic $49,742 |