Honduran vs Immigrants from Laos In Labor Force | Age 25-29
COMPARE
Honduran
Immigrants from Laos
In Labor Force | Age 25-29
In Labor Force | Age 25-29 Comparison
Hondurans
Immigrants from Laos
83.4%
IN LABOR FORCE | AGE 25-29
0.0/ 100
METRIC RATING
271st/ 347
METRIC RANK
84.8%
IN LABOR FORCE | AGE 25-29
69.0/ 100
METRIC RATING
144th/ 347
METRIC RANK
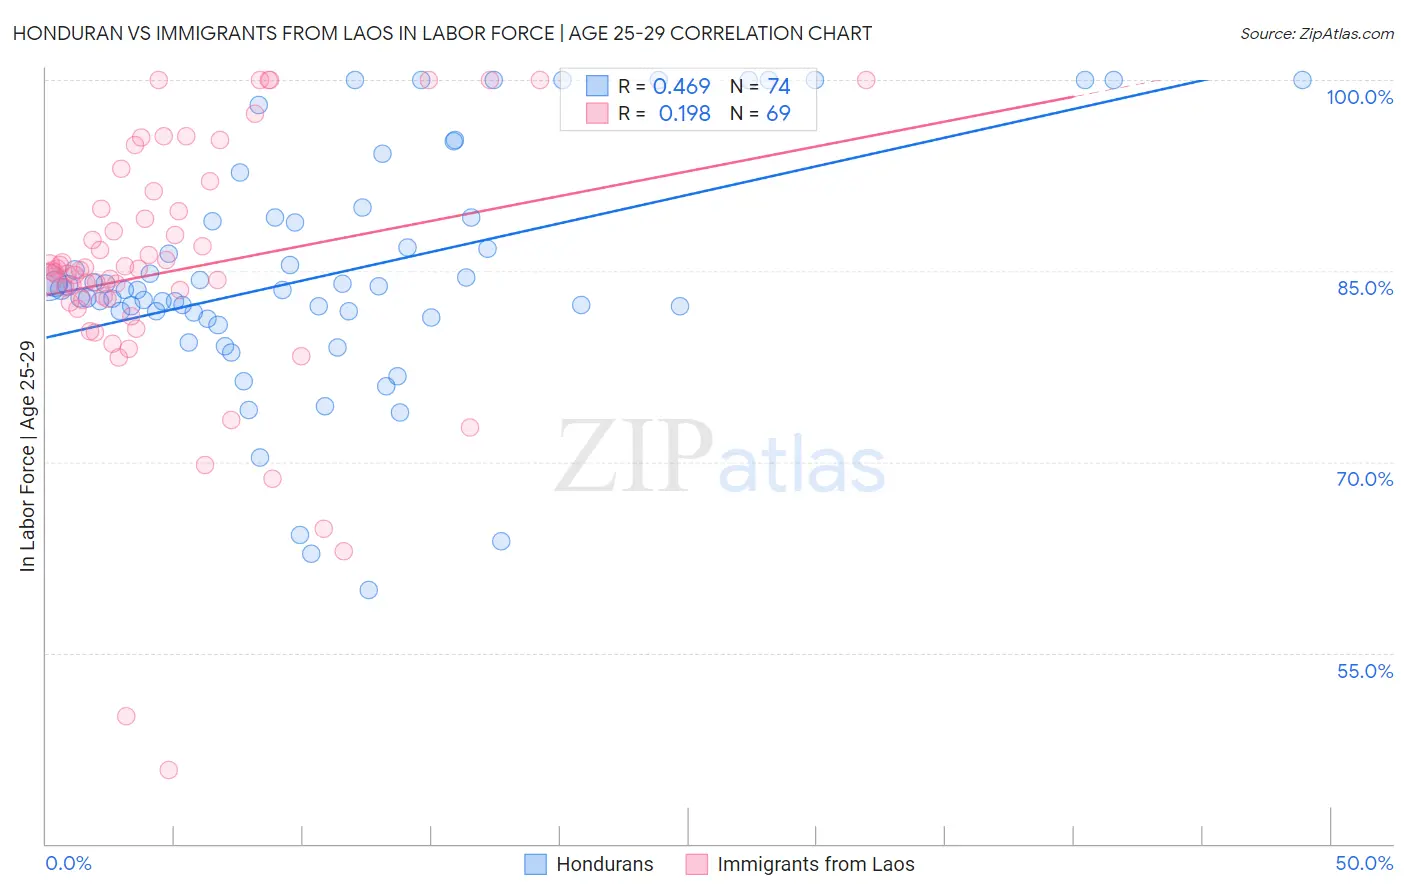
Honduran vs Immigrants from Laos In Labor Force | Age 25-29 Correlation Chart
The statistical analysis conducted on geographies consisting of 357,747,922 people shows a moderate positive correlation between the proportion of Hondurans and labor force participation rate among population between the ages 25 and 29 in the United States with a correlation coefficient (R) of 0.469 and weighted average of 83.4%. Similarly, the statistical analysis conducted on geographies consisting of 201,457,700 people shows a poor positive correlation between the proportion of Immigrants from Laos and labor force participation rate among population between the ages 25 and 29 in the United States with a correlation coefficient (R) of 0.198 and weighted average of 84.8%, a difference of 1.7%.
In Labor Force | Age 25-29 Correlation Summary
| Measurement | Honduran | Immigrants from Laos |
| Minimum | 59.9% | 45.8% |
| Maximum | 100.0% | 100.0% |
| Range | 40.1% | 54.2% |
| Mean | 84.8% | 85.0% |
| Median | 83.5% | 85.1% |
| Interquartile 25% (IQ1) | 81.7% | 82.3% |
| Interquartile 75% (IQ3) | 89.2% | 90.6% |
| Interquartile Range (IQR) | 7.5% | 8.3% |
| Standard Deviation (Sample) | 9.2% | 10.5% |
| Standard Deviation (Population) | 9.2% | 10.4% |
Similar Demographics by In Labor Force | Age 25-29
Demographics Similar to Hondurans by In Labor Force | Age 25-29
In terms of in labor force | age 25-29, the demographic groups most similar to Hondurans are Basque (83.4%, a difference of 0.020%), Immigrants from Caribbean (83.4%, a difference of 0.030%), Immigrants from Lebanon (83.4%, a difference of 0.040%), Immigrants from Barbados (83.4%, a difference of 0.040%), and Immigrants from Dominica (83.4%, a difference of 0.040%).
| Demographics | Rating | Rank | In Labor Force | Age 25-29 |
| Puget Sound Salish | 0.1 /100 | #264 | Tragic 83.5% |
| Cubans | 0.1 /100 | #265 | Tragic 83.5% |
| Aleuts | 0.0 /100 | #266 | Tragic 83.4% |
| Spanish Americans | 0.0 /100 | #267 | Tragic 83.4% |
| Immigrants | Lebanon | 0.0 /100 | #268 | Tragic 83.4% |
| Immigrants | Barbados | 0.0 /100 | #269 | Tragic 83.4% |
| Basques | 0.0 /100 | #270 | Tragic 83.4% |
| Hondurans | 0.0 /100 | #271 | Tragic 83.4% |
| Immigrants | Caribbean | 0.0 /100 | #272 | Tragic 83.4% |
| Immigrants | Dominica | 0.0 /100 | #273 | Tragic 83.4% |
| Marshallese | 0.0 /100 | #274 | Tragic 83.3% |
| Samoans | 0.0 /100 | #275 | Tragic 83.3% |
| Immigrants | Honduras | 0.0 /100 | #276 | Tragic 83.3% |
| Africans | 0.0 /100 | #277 | Tragic 83.2% |
| Immigrants | Cuba | 0.0 /100 | #278 | Tragic 83.2% |
Demographics Similar to Immigrants from Laos by In Labor Force | Age 25-29
In terms of in labor force | age 25-29, the demographic groups most similar to Immigrants from Laos are Sri Lankan (84.8%, a difference of 0.0%), Pakistani (84.8%, a difference of 0.010%), Immigrants from Senegal (84.8%, a difference of 0.010%), Icelander (84.8%, a difference of 0.010%), and Immigrants from Asia (84.8%, a difference of 0.010%).
| Demographics | Rating | Rank | In Labor Force | Age 25-29 |
| Immigrants | Canada | 73.5 /100 | #137 | Good 84.8% |
| Armenians | 72.7 /100 | #138 | Good 84.8% |
| Immigrants | Eastern Asia | 72.6 /100 | #139 | Good 84.8% |
| Immigrants | North America | 72.1 /100 | #140 | Good 84.8% |
| Danes | 71.9 /100 | #141 | Good 84.8% |
| Pakistanis | 70.0 /100 | #142 | Good 84.8% |
| Sri Lankans | 69.2 /100 | #143 | Good 84.8% |
| Immigrants | Laos | 69.0 /100 | #144 | Good 84.8% |
| Immigrants | Senegal | 68.3 /100 | #145 | Good 84.8% |
| Icelanders | 68.2 /100 | #146 | Good 84.8% |
| Immigrants | Asia | 68.2 /100 | #147 | Good 84.8% |
| Immigrants | England | 65.2 /100 | #148 | Good 84.7% |
| Peruvians | 64.7 /100 | #149 | Good 84.7% |
| Swiss | 64.7 /100 | #150 | Good 84.7% |
| Colombians | 62.8 /100 | #151 | Good 84.7% |