Sri Lankan vs Welsh In Labor Force | Age 25-29
COMPARE
Sri Lankan
Welsh
In Labor Force | Age 25-29
In Labor Force | Age 25-29 Comparison
Sri Lankans
Welsh
84.8%
IN LABOR FORCE | AGE 25-29
69.2/ 100
METRIC RATING
143rd/ 347
METRIC RANK
84.5%
IN LABOR FORCE | AGE 25-29
31.1/ 100
METRIC RATING
190th/ 347
METRIC RANK
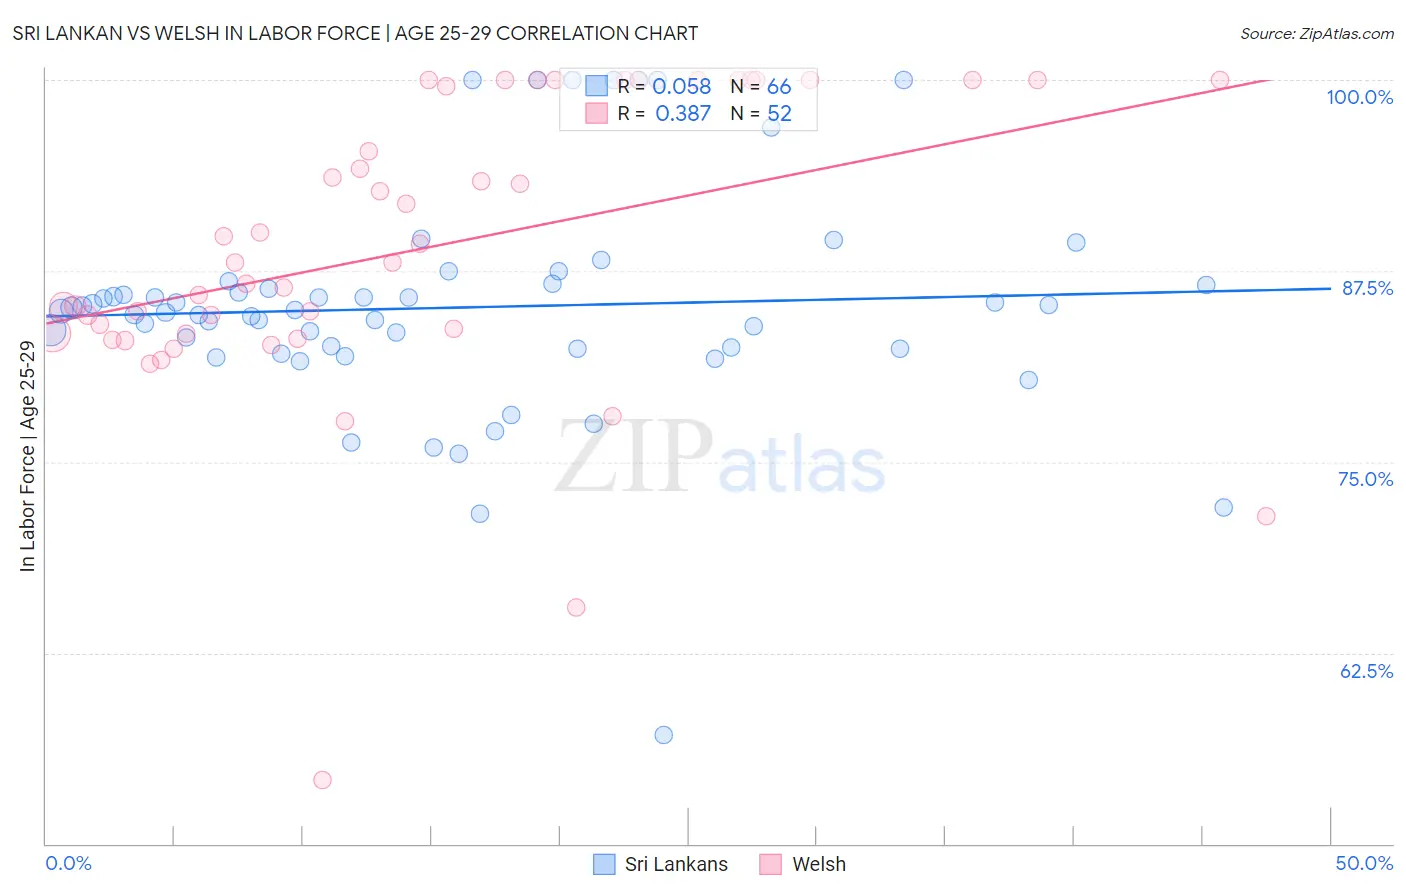
Sri Lankan vs Welsh In Labor Force | Age 25-29 Correlation Chart
The statistical analysis conducted on geographies consisting of 440,430,166 people shows a slight positive correlation between the proportion of Sri Lankans and labor force participation rate among population between the ages 25 and 29 in the United States with a correlation coefficient (R) of 0.058 and weighted average of 84.8%. Similarly, the statistical analysis conducted on geographies consisting of 527,913,112 people shows a mild positive correlation between the proportion of Welsh and labor force participation rate among population between the ages 25 and 29 in the United States with a correlation coefficient (R) of 0.387 and weighted average of 84.5%, a difference of 0.30%.
In Labor Force | Age 25-29 Correlation Summary
| Measurement | Sri Lankan | Welsh |
| Minimum | 57.1% | 54.2% |
| Maximum | 100.0% | 100.0% |
| Range | 42.9% | 45.8% |
| Mean | 85.1% | 89.0% |
| Median | 84.9% | 88.1% |
| Interquartile 25% (IQ1) | 82.4% | 83.4% |
| Interquartile 75% (IQ3) | 86.6% | 100.0% |
| Interquartile Range (IQR) | 4.2% | 16.6% |
| Standard Deviation (Sample) | 7.3% | 9.7% |
| Standard Deviation (Population) | 7.3% | 9.6% |
Similar Demographics by In Labor Force | Age 25-29
Demographics Similar to Sri Lankans by In Labor Force | Age 25-29
In terms of in labor force | age 25-29, the demographic groups most similar to Sri Lankans are Immigrants from Laos (84.8%, a difference of 0.0%), Pakistani (84.8%, a difference of 0.010%), Immigrants from Senegal (84.8%, a difference of 0.010%), Icelander (84.8%, a difference of 0.010%), and Immigrants from Asia (84.8%, a difference of 0.010%).
| Demographics | Rating | Rank | In Labor Force | Age 25-29 |
| Bhutanese | 76.0 /100 | #136 | Good 84.8% |
| Immigrants | Canada | 73.5 /100 | #137 | Good 84.8% |
| Armenians | 72.7 /100 | #138 | Good 84.8% |
| Immigrants | Eastern Asia | 72.6 /100 | #139 | Good 84.8% |
| Immigrants | North America | 72.1 /100 | #140 | Good 84.8% |
| Danes | 71.9 /100 | #141 | Good 84.8% |
| Pakistanis | 70.0 /100 | #142 | Good 84.8% |
| Sri Lankans | 69.2 /100 | #143 | Good 84.8% |
| Immigrants | Laos | 69.0 /100 | #144 | Good 84.8% |
| Immigrants | Senegal | 68.3 /100 | #145 | Good 84.8% |
| Icelanders | 68.2 /100 | #146 | Good 84.8% |
| Immigrants | Asia | 68.2 /100 | #147 | Good 84.8% |
| Immigrants | England | 65.2 /100 | #148 | Good 84.7% |
| Peruvians | 64.7 /100 | #149 | Good 84.7% |
| Swiss | 64.7 /100 | #150 | Good 84.7% |
Demographics Similar to Welsh by In Labor Force | Age 25-29
In terms of in labor force | age 25-29, the demographic groups most similar to Welsh are Moroccan (84.5%, a difference of 0.010%), Immigrants from Ukraine (84.5%, a difference of 0.020%), Zimbabwean (84.5%, a difference of 0.020%), Immigrants from Belgium (84.6%, a difference of 0.030%), and Immigrants from Portugal (84.6%, a difference of 0.030%).
| Demographics | Rating | Rank | In Labor Force | Age 25-29 |
| Scottish | 40.1 /100 | #183 | Average 84.6% |
| Immigrants | Kuwait | 38.2 /100 | #184 | Fair 84.6% |
| Immigrants | Denmark | 37.0 /100 | #185 | Fair 84.6% |
| Immigrants | Belgium | 35.0 /100 | #186 | Fair 84.6% |
| Immigrants | Portugal | 34.7 /100 | #187 | Fair 84.6% |
| Immigrants | Ukraine | 33.7 /100 | #188 | Fair 84.5% |
| Moroccans | 32.6 /100 | #189 | Fair 84.5% |
| Welsh | 31.1 /100 | #190 | Fair 84.5% |
| Zimbabweans | 28.7 /100 | #191 | Fair 84.5% |
| English | 25.8 /100 | #192 | Fair 84.5% |
| South American Indians | 25.0 /100 | #193 | Fair 84.5% |
| Portuguese | 21.2 /100 | #194 | Fair 84.4% |
| Immigrants | Israel | 20.8 /100 | #195 | Fair 84.4% |
| Immigrants | South Eastern Asia | 19.5 /100 | #196 | Poor 84.4% |
| Tlingit-Haida | 19.3 /100 | #197 | Poor 84.4% |