Samoan vs Welsh In Labor Force | Age 25-29
COMPARE
Samoan
Welsh
In Labor Force | Age 25-29
In Labor Force | Age 25-29 Comparison
Samoans
Welsh
83.3%
IN LABOR FORCE | AGE 25-29
0.0/ 100
METRIC RATING
275th/ 347
METRIC RANK
84.5%
IN LABOR FORCE | AGE 25-29
31.1/ 100
METRIC RATING
190th/ 347
METRIC RANK
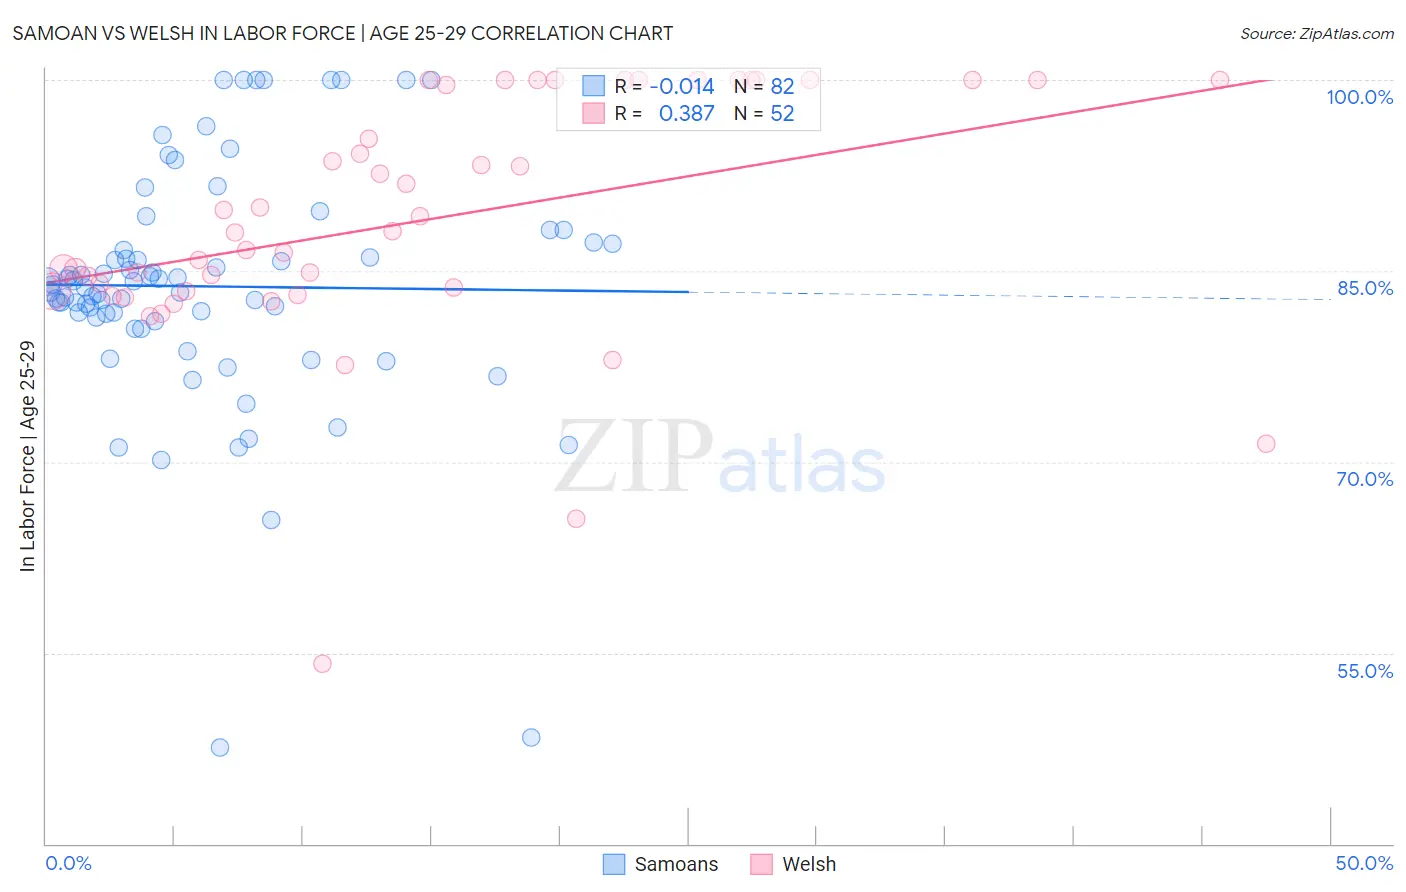
Samoan vs Welsh In Labor Force | Age 25-29 Correlation Chart
The statistical analysis conducted on geographies consisting of 225,148,243 people shows no correlation between the proportion of Samoans and labor force participation rate among population between the ages 25 and 29 in the United States with a correlation coefficient (R) of -0.014 and weighted average of 83.3%. Similarly, the statistical analysis conducted on geographies consisting of 527,913,112 people shows a mild positive correlation between the proportion of Welsh and labor force participation rate among population between the ages 25 and 29 in the United States with a correlation coefficient (R) of 0.387 and weighted average of 84.5%, a difference of 1.5%.
In Labor Force | Age 25-29 Correlation Summary
| Measurement | Samoan | Welsh |
| Minimum | 47.6% | 54.2% |
| Maximum | 100.0% | 100.0% |
| Range | 52.4% | 45.8% |
| Mean | 83.8% | 89.0% |
| Median | 83.8% | 88.1% |
| Interquartile 25% (IQ1) | 81.3% | 83.4% |
| Interquartile 75% (IQ3) | 87.1% | 100.0% |
| Interquartile Range (IQR) | 5.8% | 16.6% |
| Standard Deviation (Sample) | 9.5% | 9.7% |
| Standard Deviation (Population) | 9.4% | 9.6% |
Similar Demographics by In Labor Force | Age 25-29
Demographics Similar to Samoans by In Labor Force | Age 25-29
In terms of in labor force | age 25-29, the demographic groups most similar to Samoans are Immigrants from Honduras (83.3%, a difference of 0.0%), Marshallese (83.3%, a difference of 0.050%), Immigrants from Caribbean (83.4%, a difference of 0.070%), Immigrants from Dominica (83.4%, a difference of 0.070%), and African (83.2%, a difference of 0.070%).
| Demographics | Rating | Rank | In Labor Force | Age 25-29 |
| Immigrants | Lebanon | 0.0 /100 | #268 | Tragic 83.4% |
| Immigrants | Barbados | 0.0 /100 | #269 | Tragic 83.4% |
| Basques | 0.0 /100 | #270 | Tragic 83.4% |
| Hondurans | 0.0 /100 | #271 | Tragic 83.4% |
| Immigrants | Caribbean | 0.0 /100 | #272 | Tragic 83.4% |
| Immigrants | Dominica | 0.0 /100 | #273 | Tragic 83.4% |
| Marshallese | 0.0 /100 | #274 | Tragic 83.3% |
| Samoans | 0.0 /100 | #275 | Tragic 83.3% |
| Immigrants | Honduras | 0.0 /100 | #276 | Tragic 83.3% |
| Africans | 0.0 /100 | #277 | Tragic 83.2% |
| Immigrants | Cuba | 0.0 /100 | #278 | Tragic 83.2% |
| British West Indians | 0.0 /100 | #279 | Tragic 83.2% |
| Dominicans | 0.0 /100 | #280 | Tragic 83.2% |
| Immigrants | Dominican Republic | 0.0 /100 | #281 | Tragic 83.1% |
| Americans | 0.0 /100 | #282 | Tragic 83.1% |
Demographics Similar to Welsh by In Labor Force | Age 25-29
In terms of in labor force | age 25-29, the demographic groups most similar to Welsh are Moroccan (84.5%, a difference of 0.010%), Immigrants from Ukraine (84.5%, a difference of 0.020%), Zimbabwean (84.5%, a difference of 0.020%), Immigrants from Belgium (84.6%, a difference of 0.030%), and Immigrants from Portugal (84.6%, a difference of 0.030%).
| Demographics | Rating | Rank | In Labor Force | Age 25-29 |
| Scottish | 40.1 /100 | #183 | Average 84.6% |
| Immigrants | Kuwait | 38.2 /100 | #184 | Fair 84.6% |
| Immigrants | Denmark | 37.0 /100 | #185 | Fair 84.6% |
| Immigrants | Belgium | 35.0 /100 | #186 | Fair 84.6% |
| Immigrants | Portugal | 34.7 /100 | #187 | Fair 84.6% |
| Immigrants | Ukraine | 33.7 /100 | #188 | Fair 84.5% |
| Moroccans | 32.6 /100 | #189 | Fair 84.5% |
| Welsh | 31.1 /100 | #190 | Fair 84.5% |
| Zimbabweans | 28.7 /100 | #191 | Fair 84.5% |
| English | 25.8 /100 | #192 | Fair 84.5% |
| South American Indians | 25.0 /100 | #193 | Fair 84.5% |
| Portuguese | 21.2 /100 | #194 | Fair 84.4% |
| Immigrants | Israel | 20.8 /100 | #195 | Fair 84.4% |
| Immigrants | South Eastern Asia | 19.5 /100 | #196 | Poor 84.4% |
| Tlingit-Haida | 19.3 /100 | #197 | Poor 84.4% |