Immigrants from Malaysia vs Delaware In Labor Force | Age 25-29
COMPARE
Immigrants from Malaysia
Delaware
In Labor Force | Age 25-29
In Labor Force | Age 25-29 Comparison
Immigrants from Malaysia
Delaware
85.0%
IN LABOR FORCE | AGE 25-29
90.4/ 100
METRIC RATING
114th/ 347
METRIC RANK
83.7%
IN LABOR FORCE | AGE 25-29
0.2/ 100
METRIC RATING
257th/ 347
METRIC RANK
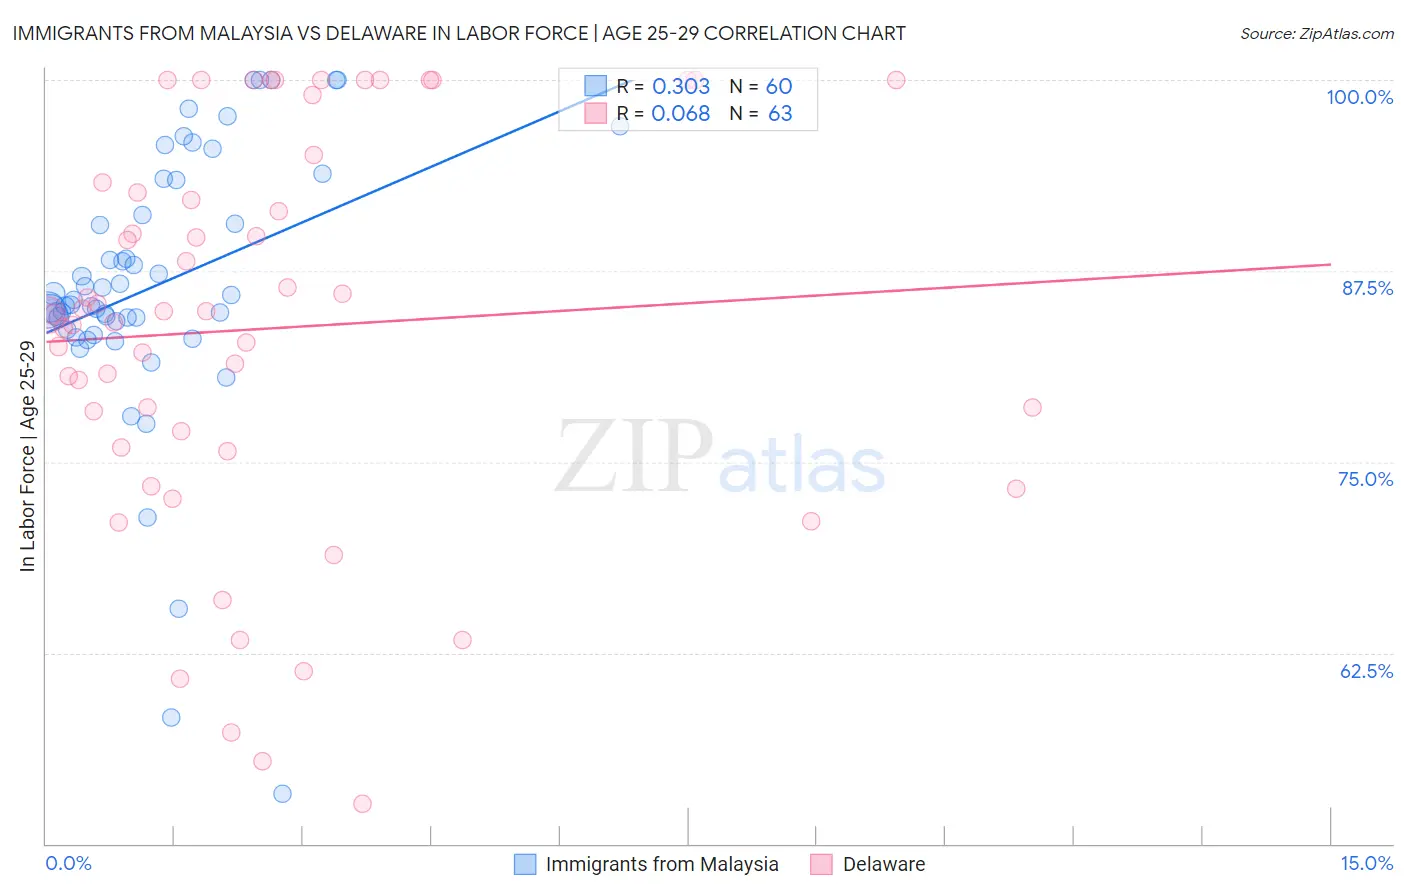
Immigrants from Malaysia vs Delaware In Labor Force | Age 25-29 Correlation Chart
The statistical analysis conducted on geographies consisting of 197,964,000 people shows a mild positive correlation between the proportion of Immigrants from Malaysia and labor force participation rate among population between the ages 25 and 29 in the United States with a correlation coefficient (R) of 0.303 and weighted average of 85.0%. Similarly, the statistical analysis conducted on geographies consisting of 96,226,507 people shows a slight positive correlation between the proportion of Delaware and labor force participation rate among population between the ages 25 and 29 in the United States with a correlation coefficient (R) of 0.068 and weighted average of 83.7%, a difference of 1.6%.
In Labor Force | Age 25-29 Correlation Summary
| Measurement | Immigrants from Malaysia | Delaware |
| Minimum | 53.3% | 52.6% |
| Maximum | 100.0% | 100.0% |
| Range | 46.7% | 47.4% |
| Mean | 86.5% | 83.7% |
| Median | 85.4% | 84.7% |
| Interquartile 25% (IQ1) | 83.9% | 75.9% |
| Interquartile 75% (IQ3) | 92.3% | 93.3% |
| Interquartile Range (IQR) | 8.4% | 17.4% |
| Standard Deviation (Sample) | 9.0% | 12.8% |
| Standard Deviation (Population) | 8.9% | 12.7% |
Similar Demographics by In Labor Force | Age 25-29
Demographics Similar to Immigrants from Malaysia by In Labor Force | Age 25-29
In terms of in labor force | age 25-29, the demographic groups most similar to Immigrants from Malaysia are Senegalese (85.0%, a difference of 0.010%), Irish (85.0%, a difference of 0.010%), Immigrants from Middle Africa (85.0%, a difference of 0.020%), Immigrants from Austria (85.0%, a difference of 0.030%), and Costa Rican (85.0%, a difference of 0.030%).
| Demographics | Rating | Rank | In Labor Force | Age 25-29 |
| Immigrants | Southern Europe | 92.3 /100 | #107 | Exceptional 85.0% |
| Immigrants | Austria | 91.9 /100 | #108 | Exceptional 85.0% |
| Costa Ricans | 91.9 /100 | #109 | Exceptional 85.0% |
| New Zealanders | 91.5 /100 | #110 | Exceptional 85.0% |
| Immigrants | Middle Africa | 91.4 /100 | #111 | Exceptional 85.0% |
| Senegalese | 90.9 /100 | #112 | Exceptional 85.0% |
| Irish | 90.6 /100 | #113 | Exceptional 85.0% |
| Immigrants | Malaysia | 90.4 /100 | #114 | Exceptional 85.0% |
| South Africans | 88.9 /100 | #115 | Excellent 85.0% |
| Chileans | 88.8 /100 | #116 | Excellent 85.0% |
| Immigrants | Belarus | 88.0 /100 | #117 | Excellent 85.0% |
| Finns | 87.8 /100 | #118 | Excellent 85.0% |
| Filipinos | 87.1 /100 | #119 | Excellent 84.9% |
| Immigrants | South Africa | 86.1 /100 | #120 | Excellent 84.9% |
| Immigrants | Chile | 85.6 /100 | #121 | Excellent 84.9% |
Demographics Similar to Delaware by In Labor Force | Age 25-29
In terms of in labor force | age 25-29, the demographic groups most similar to Delaware are Immigrants from Haiti (83.7%, a difference of 0.010%), Haitian (83.7%, a difference of 0.020%), Guatemalan (83.7%, a difference of 0.030%), Immigrants from Trinidad and Tobago (83.7%, a difference of 0.030%), and Spaniard (83.7%, a difference of 0.030%).
| Demographics | Rating | Rank | In Labor Force | Age 25-29 |
| Central Americans | 0.2 /100 | #250 | Tragic 83.7% |
| Bahamians | 0.2 /100 | #251 | Tragic 83.7% |
| Guatemalans | 0.2 /100 | #252 | Tragic 83.7% |
| Immigrants | Trinidad and Tobago | 0.2 /100 | #253 | Tragic 83.7% |
| Spaniards | 0.2 /100 | #254 | Tragic 83.7% |
| Haitians | 0.2 /100 | #255 | Tragic 83.7% |
| Immigrants | Haiti | 0.2 /100 | #256 | Tragic 83.7% |
| Delaware | 0.2 /100 | #257 | Tragic 83.7% |
| Immigrants | Guatemala | 0.1 /100 | #258 | Tragic 83.6% |
| Spanish | 0.1 /100 | #259 | Tragic 83.6% |
| Immigrants | Bahamas | 0.1 /100 | #260 | Tragic 83.6% |
| Pennsylvania Germans | 0.1 /100 | #261 | Tragic 83.6% |
| Immigrants | Fiji | 0.1 /100 | #262 | Tragic 83.6% |
| West Indians | 0.1 /100 | #263 | Tragic 83.5% |
| Puget Sound Salish | 0.1 /100 | #264 | Tragic 83.5% |